• Skip to primary navigation
  • Skip to main content
  • Skip to primary sidebar

An Antic Disposition

  • Home
  • About
  • Archives
  • Writings
  • Links
You are here: Home / Archives for Apache

Apache

The Power of Brand and the Power of Product Redux

2014/10/28 By Rob 4 Comments

Last year I did a three-part blog (“The Power of Brand and the Power of Product”) describing a simple model of product adoption and market share, and showed how the parameters of that model could be determined using a single survey question.     I used the open source productivity suites, OpenOffice and LibreOffice, as examples.   It is now time to update that analysis with the most-recent survey data. (If you want to look up the original posts, here are the links: part one, part two, part three).

To recap the methodology,  I conducted a survey using Google’s Consumer Survey service, which uses sampling and post-stratification weighting to match the target population, which in this case was the U.S. internet population.  In other words, the survey is weighted to reflect the population demographics, for age, sex, region of the country, urban versus rural,  income, etc.

The question in the survey was:

What is your familiarity with the software application called “OpenOffice”?

  •  I have never heard of it
  • I am aware of it but have never used it
  • I have tried it once
  • I use it only sometimes
  • I use it on a regular basis

With 1502 responses, the results were:

I have never heard of it 61.3%
I am aware of it but have never used it 13.3%
I have tried it once 7.6%
I use it only sometimes 10.3%
I use it on a regular basis 7.5%


The same question was asked about LibreOffice, with results:

I have never heard of it 82.3%
I am aware of it but have never used it 5.8%
I have tried it once 4.4%
I use it only sometimes 3.1%
I use it on a regular basis 4.3%


Now these numbers are somewhat interesting on their own, but what is far more interesting are the derived metrics, which look at things like:

  • What is the name recognition of the product?
  • Of those who have heard of the product, what percentage actually give it a try?    This is a measure of marketing effectiveness.
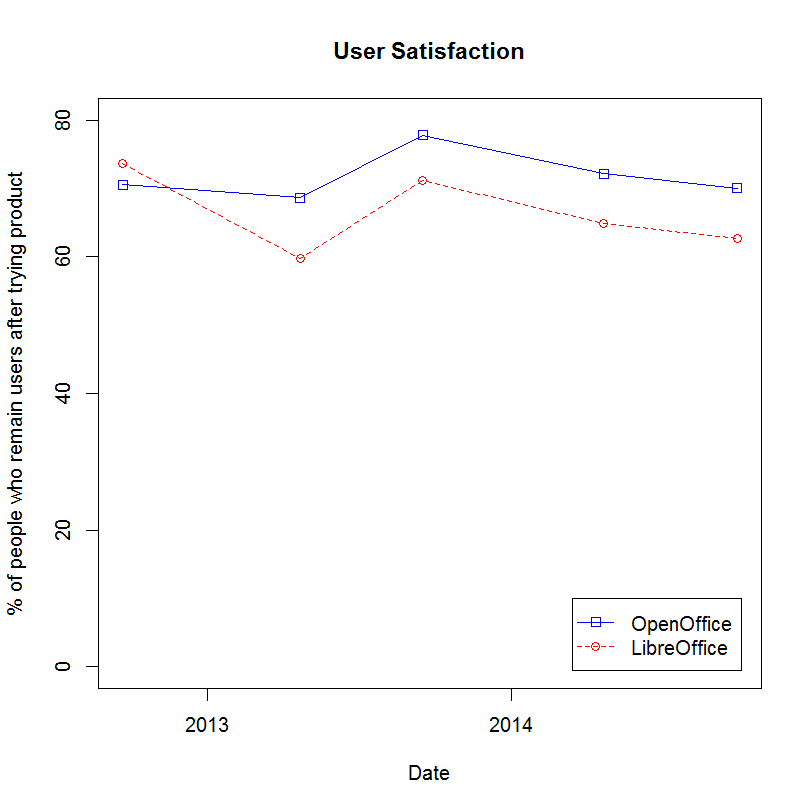
  • Of those who have tried the product, what percentage actually continue to use it?  This is a measure of user satisfaction.
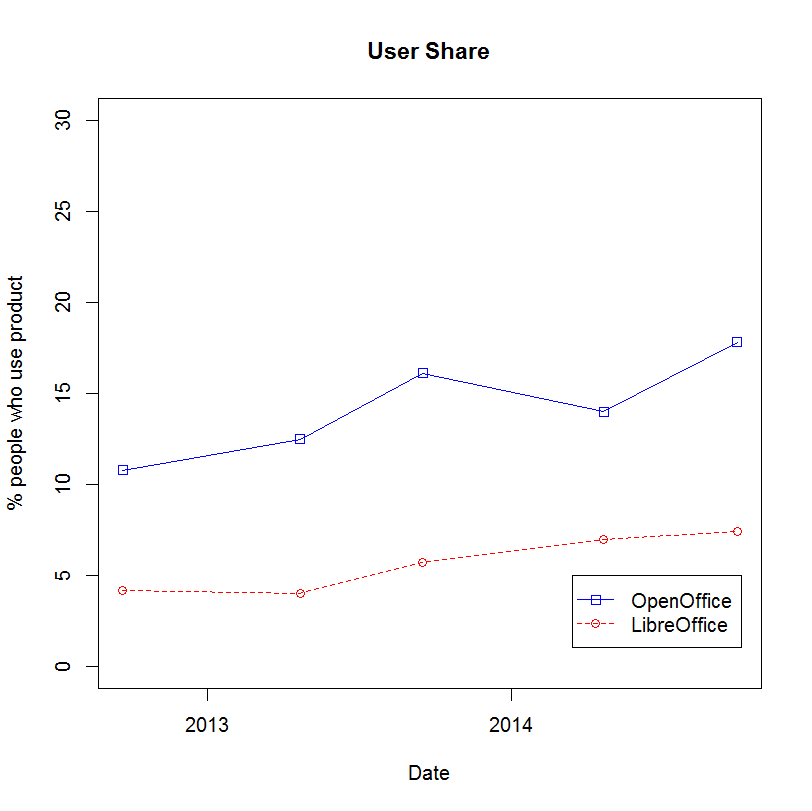
  • What percentage of all respondents use the product?  This is a measure of market share.

Full details on how these other metrics are calculated, from this single survey question, can be found in Part One of this series.

Here are some charts to show how these metrics have evolved over the 2 1/2 years I’ve worked with this survey approach:
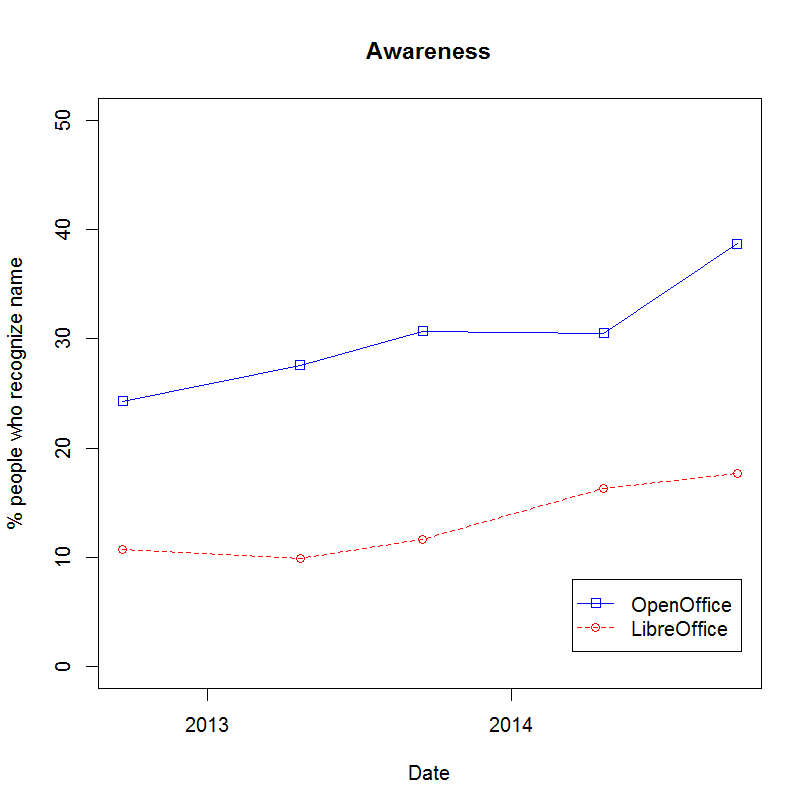
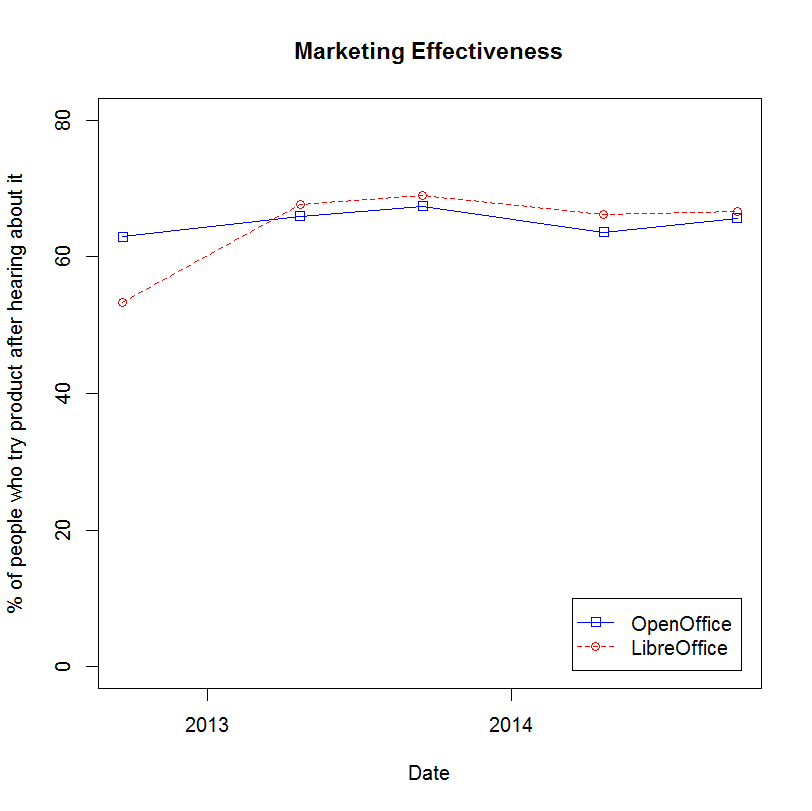
 

awarenessmarketing-effectivenessuser_satisfactionuser-shareThose who know me know that I am partial to OpenOffice, an open source project that I contribute to.   So I am extremely pleased to see it continue to advance in all fronts.   Since coming to Apache, OpenOffice’s name recognition has grown from 24% to 39% and the user share has grown from 11% to 18%, while keeping user satisfaction constant.   This is a testament to the hard work of the many talented volunteers at Apache.
  • Tweet

Filed Under: Apache, Marketing, Open Source, OpenOffice

The Power of Brand and the Power of Product, Part 3

2013/10/21 By Rob Leave a Comment

In the previous two parts (one and two) I described a model of product adoption and market share that could be built with a single survey question.   I applied this model to the open source productivity suites OpenOffice and LibreOffice, looking at adoption in September 2012 and April 2013.

The results were described in detail in the previous article in this series, but can be summarized as:

 OpenOffice September 2012 April 2013 Change
Customer Awareness 24.3% 27.6% 14% growth
Customer Motivation 63.0% 65.9% 5% growth
Customer Satisfaction 70.6% 68.7% 3% decline
Market Share 10.8% 12.5% 16% growth


Six months have now passed and it is worth taking another look to see how things have evolved.  As I did previously, I used Google’s  Consumer Survey service which uses sampling and post-stratification weighting to match the target population, which in this case was the US internet population.  In other words, the survey is weighted to reflect the population demographics, for age, sex, region of the country, urban versus rural,  income, etc.   I did this survey in a personal capacity for my own interest.  The Standard Disclaimer applies.

OpenOffice (N=1519) September 2012 April 2013 September 2013 Change (September to September)
Customer Awareness 24.3% 27.6% 30.7% 26% growth
Customer Motivation 63.0% 65.9% 67.4% 7% growth
Customer Satisfaction 70.6% 68.7% 77.8% 10% growth
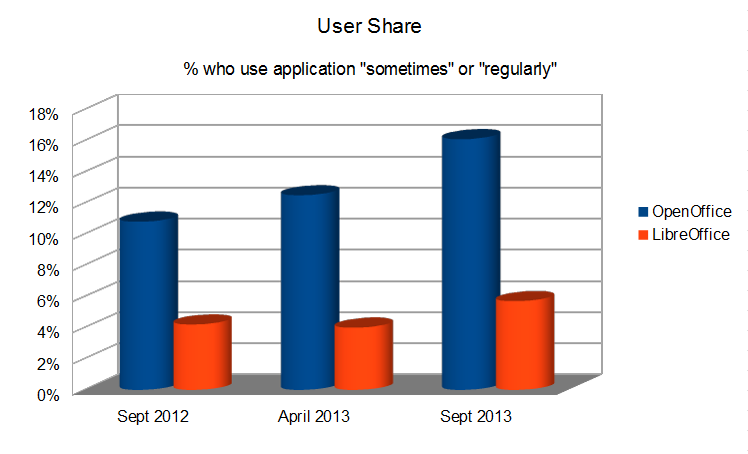
Market Share 10.8% 12.5% 16.1% 49% growth


So what do we see?  Very nice results, indeed.  The OpenOffice brand is strong and growing.  Over 30% of consumers surveyed had heard of it.  Of those who had heard of it, 67% had given it a try.  That number is changed little.  This is an opportunity for Apache OpenOffice marketing volunteers to improve both of these numbers.  Of those who tried OpenOffice almost 78% continued to use OpenOffice.  This is a modest increase, but there is certainly room to improve here.   Put it altogether, and the estimated user share, the percentage of US internet users who use OpenOffice “sometimes” or “regularly” is 16.1%, nearly a 50% improvement year-over-year.

In any case, to summarize and to illustrate the improvements graphically, I’ve charted the growth in user share over the three surveys, including results for LibreOffice as well:

use-survey-sept-2013

  • Tweet

Filed Under: Apache, Marketing, Open Source, OpenOffice

Mapping the ASF, Part II

2013/05/06 By Rob 1 Comment

In my last post I showed you one view of the Apache Software Foundation, the relationship of projects as revealed by the overlapping membership of their Project Management Committees.  After I did that post it struck me that I could, with a very small modifications to my script, look at the connections at the individual level instead of at the committee level.  Initially I attempted this with all Committers in the ASF   This resulted in a graph with over 3000 nodes and over 2.6 million edges.   I’m still working on making sense of that graph.  It was very dense and visualizing it as anything other than a giant blob has proven challenging.  So I scaled back the problem slightly and decided to look at the relationship between individual members of the many PMCs, a smaller graph with only 1577 nodes and 22,399 edges.

Here’s what I got:


As before I excluded the Apache Incubator, Labs and Attic, but looked at all other PMC members.  Each PMC member is a dot in this graph, with a line connecting two people who serve together on a PMC.  The layout and colors emphasizes communities of strong interconnection.  An SVG version of the graph is here.

Each PMC is a “clique”, a group that strongly interacts with itself.  But aside from a small number of exceptions, which you can see at the top of the graph, each PMC has one or more members who are also members of other PMCs.    In structural terms they are “between” the two communities and help connect them.  This could mean various things in social terms, from acting as a conduit of information, a broker, or even a gatekeeper.  The person who introduces you to new people at a party serves the same role as the person who tells the prisoner stories of the outside world.  The context is different, of course, but in either case, the structural position is one of importance.

A common way of quantifying the importance of the nodes that connect other nodes, is via a metric called “betweenness centrality“, which you can think of as a measure of how many shortest paths between other nodes pass through that node.  If the shortest path is always going through you, then you have high betweenness and you’re helping connecting the disparate parts of the organization.

Let’s draw the graph again and show each node with a size proportionate to its betweenness.  You can see more clearly now the position of the high betweenness nodes and how they bridge sub-communities.

Now of course, the structural role doesn’t necessarily equate to the actual social role.  Someone could be inactive or lurking in multiple projects and not serve as the conduit of much of anything, though on paper they appear central.   But Apache participants might take a look at this larger version of the chart, where I have labeled the nodes, and see how well it matches reality in many ways.

  • Tweet

Filed Under: Apache, Social Network Analysis

Mapping the Apache Software Foundation

2013/05/03 By Rob 2 Comments

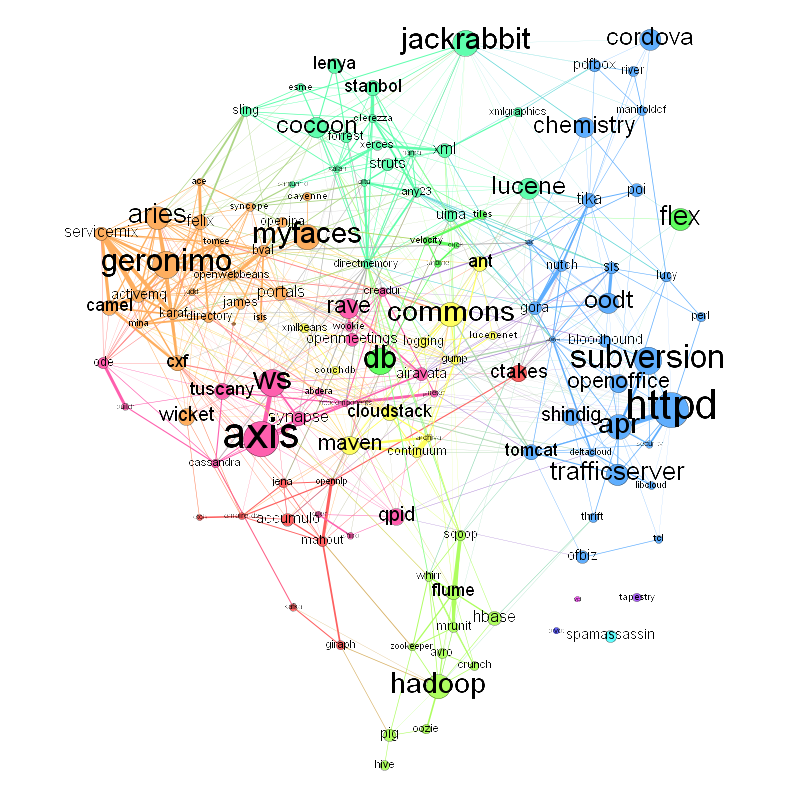
So, what do we have here?   This is a graph of Apache projects and how they are related, by one definition of “related” in any case.  Click on the image for a larger PNG version, or here if you would like an SVG.

Each labeled circle (node) in the graph represents one project at Apache.  Or to be specific it represents the membership of a single Project Management Committee (PMC),  the leadership committee that each Apache project has.  The size of the node is proportionate to the size of the PMC.    You can see that the largest PMCs are Apache Axis (56 members),  Httpd (55 members), Subversion (42 members), WS (41 members) and Geronimo (also 41 members).

The edges between the PMC nodes represent the ties between the PMCs as revealed by overlapping membership.  So PMCs that have a larger number of members in common have a thicker line connecting them.  I used the Sørensen–Dice coefficient to express the overlap.  This is a simple calculation that looks at the overlap in membership of two sets, scaled by the size of the individual sets.  It varies from 0 to 1,  with 0 meaning no overlap at all and 1 meaning total overlap.    An example:  Look at the bottom of the graph at the thick line connecting Apache Flume and Sqoop.  The Flume PMC has 20 members and the Sqoop PMC has 13.  They have 6 members in common, so the Dice coefficient is (2*6)/(20+13) = 0.36.   The highest weight edge in the graph is that between Apache Httpd and the Apache Portable Runtime (APR), with a coefficient of 0.52.

(Observant Apache participants will note that the chart is missing some PMCs.  I omitted Apache Labs, Incubator and Attic since they are umbrella projects representing parts of a project lifecycle.  They don’t have a specific technical orientation and the commonality in membership would not mean anything.  I left out Comdev as well, for the similar reasons.)

The color for each node was determined by a community-detection algorithm (modularity) which finds projects that have a high degree of interconnection.  This has brought out some of the larger trends within Apache, such as the grouping of cloud-related projects, big data related ones, content management,  enterprise middleware, etc.  What is interesting is that this graph was created without knowing anything at all about the technology within each project.  The graph is based on PMC membership data only.  So individual volunteers, by their choice of what projects they work, is the motive force behind these groupings.

Some other interesting facts:

  • The PMCs with connections to the most other PMCs are Commons (34), WS (32), DirectMemory (31), Aries (28) and Geronimo (28).
  • If you look at the most connections to other PMCs (subtly different from the above since it is possible to have more than one member in another PMCs) the top projects are: DirectMemory, Karaf, Servicemix, BVal and Geronimo.
  • Betweeness centrality looks at the importance of a node with respect to helping connect other nodes.  It looks at the shortest path between all pairs of nodes, and which specific nodes are most often the ones that are passed through on these shortest paths.  If we were looking at a graph of air traffic routes, the hub cities would be the ones with the highest centrality.  If we were looking at how to communicate an idea, influence opinion, or to spread an infectious  disease (all the same thing, really), these central nodes are ones to look at.  The PMCs at Apache with the highest betweeness are: Commons, DirectMemory, WS, Httpd and Portals.

So how did I do this?

The core data I got from scraping this page, which lists all Apache committers.  I did this in Python using BeautifulSoup, building up the PMC membership in a dictionary.  Then Python’s set operations made calculating the Dice coefficient a simple task:

    intersect = SetA.intersection(SetB)

    dice = (2.0*len(intersect)/(len(SetA)+len(SetB)))

The script then wrote out the graph data, include node size and edge weight into a Gexf-format XML file, which I then processed using Gephi.  Here’s the data file I used if you want to play with the data yourself.

In Part II of this series, I’ll take a look at finer-grained data, at the social network graph of Apache Software Foundation participants at the individual level.

  • Tweet

Filed Under: Apache, Social Network Analysis

From the Whispers of ApacheCon…

2012/10/20 By Rob 10 Comments

From the whispers of ApacheCon, OpenOffice.org may never leave the incubator project. The intention may be to do a thorough code audit and produce one last, clean release that the rival LibreOffice can absorb.

That was what you may have heard 10 months ago,  if you listened to the rumormongers.   Certainly there were a lot of rumors being spread.  (Or should we call it FUD?)  Whatever you call it, the whispers continued, in a negative propaganda campaign that the open source community should be ashamed to be associated with.   Even just a few weeks ago I heard from one LibreOffice lead that he was certain that the Apache OpenOffice podling would never graduate and that we’d fail, give up, shut down the project and give the OpenOffice trademarks to LibreOffice.  I’m sorry to disappoint, but this kind of FUD has an expiration date, and that date is now.

From the whispers of ApacheCon…

Yes, you will hear talk of OpenOffice at ApacheCon next month, a lot of it, but it will be quite in the open, no whispers there.  The Apache OpenOffice Project, no longer a “podling”, (Did I neglect to mention that we graduated from the Apache Incubator in a unanimous ASF Board resolution?) will be running a track dedicated to OpenOffice and related technologies.

And as for a clean release that LibreOffice can “absorb”, they are welcome to it.  In fact they have for several months now been merging (“rebasing” is there preferred term) Apache OpenOffice code into LibreOffice, and I couldn’t be happier about it.    Ironically, after demonizing the permissive Apache License,  it is for this very reason that LibreOffice is doing this “rebasing”, to escape from the constraints of LGPL.   After all the demagoguery, their source files will now carry an Apache License notice.

I need not repeat the long list of other false predictions and rumors: that we would never be able to bring the product’s IP up to Apache standards (we did), that we would not be able to issue security patches for OpenOffice (we did),  that we would never get a release out the door (we did, twice), that we had delayed too long in our release and were thus irrelevant (we had more downloads in 4 months than LibreOffice has had  in 2 years), that we would never contribute developers to the OpenOffice effort (we have), that we would never donate Symphony to Apache (we did), that we would dominate the project (we don’t) or that we would force Symphony to be the new base of OpenOffice (we didn’t), etc.  The FUD went on and on and continues even today, combined with exaggerations of their own modest achievements.

It is probably a vain hope to expect the FUD to stop now that we’ve graduated, though I would be happy to be wrong.  But at the very least I think we’ve established a record of accomplishment that stands in stark contrast to the repeated false predictions of the anti-Apache whisper campaign.  And it is worth noting this,  and preserving some skepticism when hearing further FUD from these same sources.   And this is something worth saying louder than a whisper.

  • Tweet

Filed Under: Apache, FUD, OpenOffice

  • Go to page 1
  • Go to page 2
  • Go to page 3
  • Go to Next Page »

Primary Sidebar

Copyright © 2006-2023 Rob Weir · Site Policies


Loading Comments...