• Skip to primary navigation
  • Skip to main content
  • Skip to primary sidebar

An Antic Disposition

  • Home
  • About
  • Archives
  • Writings
  • Links
You are here: Home / Archives for Marketing

Marketing

The Power of Brand and the Power of Product Redux

2014/10/28 By Rob 4 Comments

Last year I did a three-part blog (“The Power of Brand and the Power of Product”) describing a simple model of product adoption and market share, and showed how the parameters of that model could be determined using a single survey question.     I used the open source productivity suites, OpenOffice and LibreOffice, as examples.   It is now time to update that analysis with the most-recent survey data. (If you want to look up the original posts, here are the links: part one, part two, part three).

To recap the methodology,  I conducted a survey using Google’s Consumer Survey service, which uses sampling and post-stratification weighting to match the target population, which in this case was the U.S. internet population.  In other words, the survey is weighted to reflect the population demographics, for age, sex, region of the country, urban versus rural,  income, etc.

The question in the survey was:

What is your familiarity with the software application called “OpenOffice”?

  •  I have never heard of it
  • I am aware of it but have never used it
  • I have tried it once
  • I use it only sometimes
  • I use it on a regular basis

With 1502 responses, the results were:

I have never heard of it 61.3%
I am aware of it but have never used it 13.3%
I have tried it once 7.6%
I use it only sometimes 10.3%
I use it on a regular basis 7.5%


The same question was asked about LibreOffice, with results:

I have never heard of it 82.3%
I am aware of it but have never used it 5.8%
I have tried it once 4.4%
I use it only sometimes 3.1%
I use it on a regular basis 4.3%


Now these numbers are somewhat interesting on their own, but what is far more interesting are the derived metrics, which look at things like:

  • What is the name recognition of the product?
  • Of those who have heard of the product, what percentage actually give it a try?    This is a measure of marketing effectiveness.
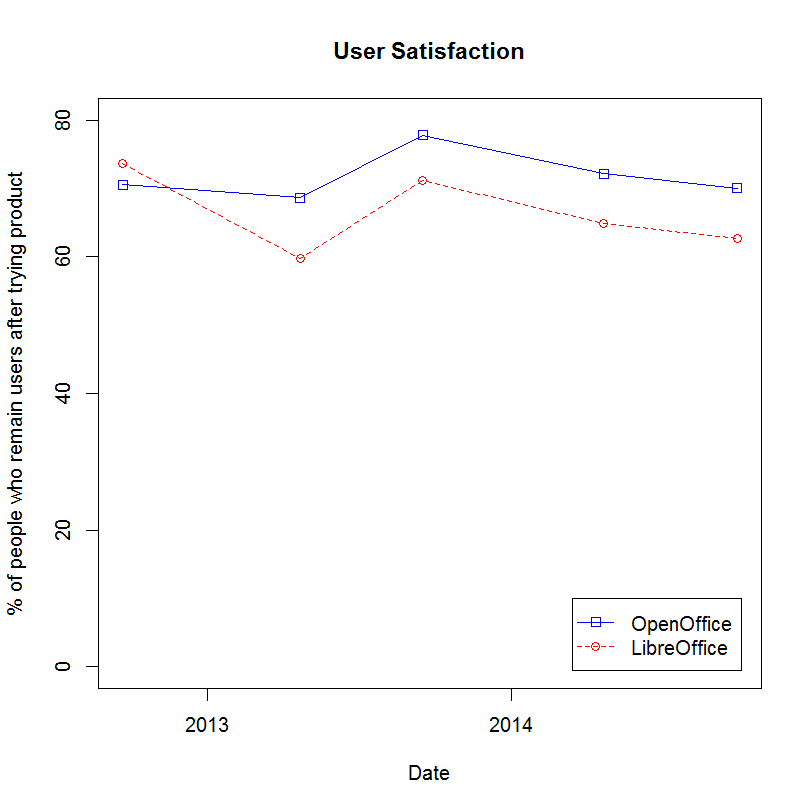
  • Of those who have tried the product, what percentage actually continue to use it?  This is a measure of user satisfaction.
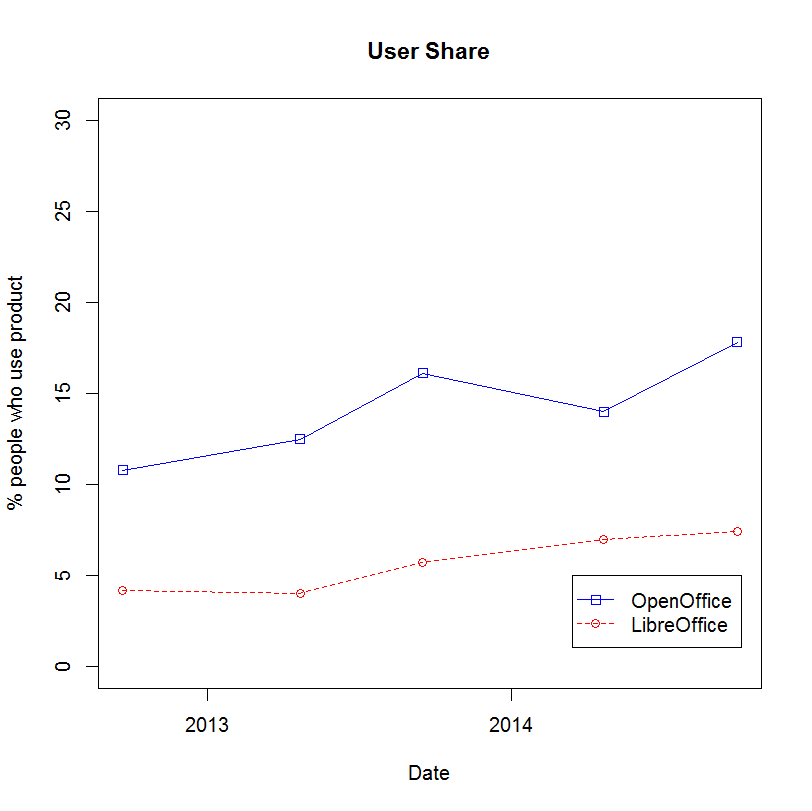
  • What percentage of all respondents use the product?  This is a measure of market share.

Full details on how these other metrics are calculated, from this single survey question, can be found in Part One of this series.

Here are some charts to show how these metrics have evolved over the 2 1/2 years I’ve worked with this survey approach:
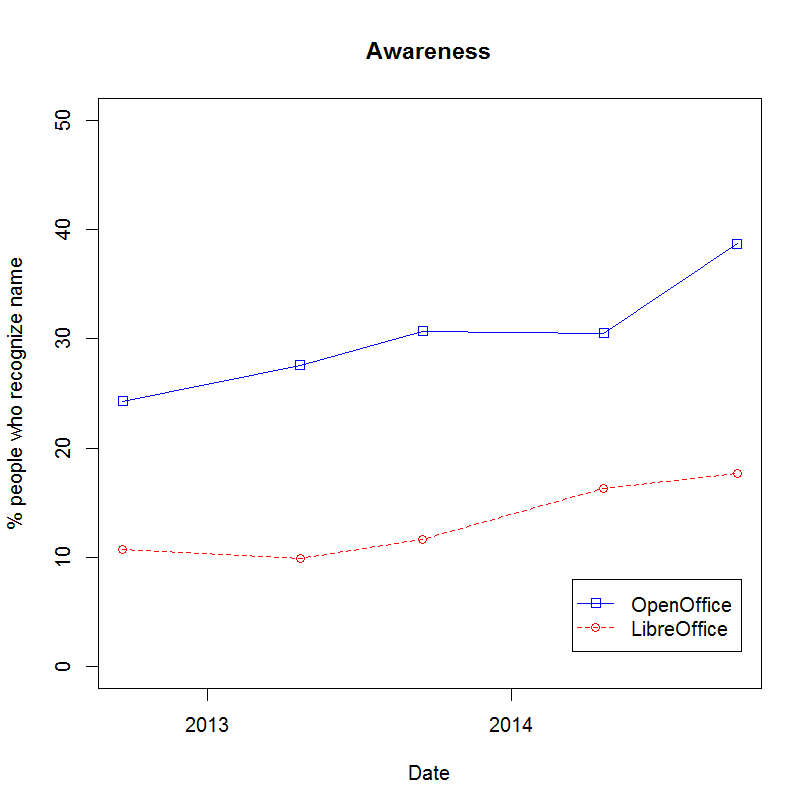
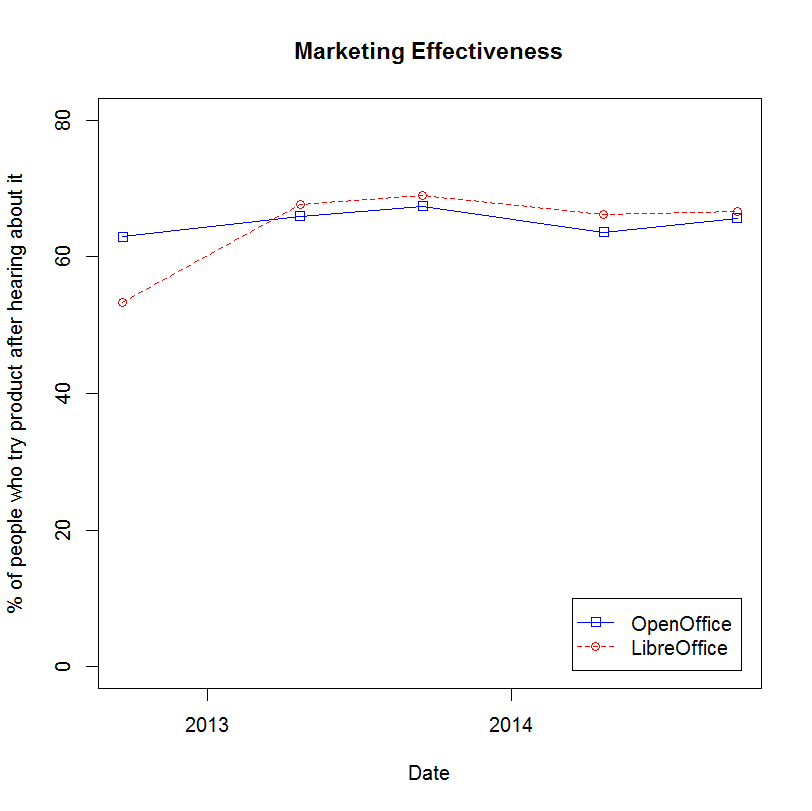
 

awarenessmarketing-effectivenessuser_satisfactionuser-shareThose who know me know that I am partial to OpenOffice, an open source project that I contribute to.   So I am extremely pleased to see it continue to advance in all fronts.   Since coming to Apache, OpenOffice’s name recognition has grown from 24% to 39% and the user share has grown from 11% to 18%, while keeping user satisfaction constant.   This is a testament to the hard work of the many talented volunteers at Apache.
  • Tweet

Filed Under: Apache, Marketing, Open Source, OpenOffice

The Power of Brand and the Power of Product, Part 3

2013/10/21 By Rob Leave a Comment

In the previous two parts (one and two) I described a model of product adoption and market share that could be built with a single survey question.   I applied this model to the open source productivity suites OpenOffice and LibreOffice, looking at adoption in September 2012 and April 2013.

The results were described in detail in the previous article in this series, but can be summarized as:

 OpenOffice September 2012 April 2013 Change
Customer Awareness 24.3% 27.6% 14% growth
Customer Motivation 63.0% 65.9% 5% growth
Customer Satisfaction 70.6% 68.7% 3% decline
Market Share 10.8% 12.5% 16% growth


Six months have now passed and it is worth taking another look to see how things have evolved.  As I did previously, I used Google’s  Consumer Survey service which uses sampling and post-stratification weighting to match the target population, which in this case was the US internet population.  In other words, the survey is weighted to reflect the population demographics, for age, sex, region of the country, urban versus rural,  income, etc.   I did this survey in a personal capacity for my own interest.  The Standard Disclaimer applies.

OpenOffice (N=1519) September 2012 April 2013 September 2013 Change (September to September)
Customer Awareness 24.3% 27.6% 30.7% 26% growth
Customer Motivation 63.0% 65.9% 67.4% 7% growth
Customer Satisfaction 70.6% 68.7% 77.8% 10% growth
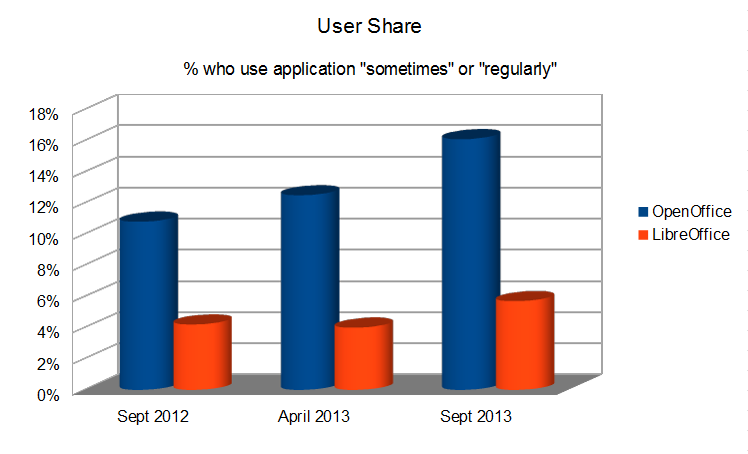
Market Share 10.8% 12.5% 16.1% 49% growth


So what do we see?  Very nice results, indeed.  The OpenOffice brand is strong and growing.  Over 30% of consumers surveyed had heard of it.  Of those who had heard of it, 67% had given it a try.  That number is changed little.  This is an opportunity for Apache OpenOffice marketing volunteers to improve both of these numbers.  Of those who tried OpenOffice almost 78% continued to use OpenOffice.  This is a modest increase, but there is certainly room to improve here.   Put it altogether, and the estimated user share, the percentage of US internet users who use OpenOffice “sometimes” or “regularly” is 16.1%, nearly a 50% improvement year-over-year.

In any case, to summarize and to illustrate the improvements graphically, I’ve charted the growth in user share over the three surveys, including results for LibreOffice as well:

use-survey-sept-2013

  • Tweet

Filed Under: Apache, Marketing, Open Source, OpenOffice

The Power of Brand and the Power of Product, Part 2

2013/06/12 By Rob

In Part 1 of this series we looked at a model of product adoption and market share that had a special and valuable property:  the parameters of the model could be derived from a single survey question, e.g.:

“What is your awareness with the hand cream called Whizzo-Soft?”

A. I have never heard of it.

B. I have heard of it but I have never tried it.

C. I have tried it once.

D. I use it sometimes.

E. I use it regularly.

Given N responses to that survey questions you can derive the factors in the model by simple math:

  • Customer Awareness = 1 – A/N
  • Customer Motivation = (C + D + E) / (N -A)
  • Customer Satisfaction = (D + E)/(N – A – B)
  • Market Share = Customer Awareness * Customer Motivation * Customer Satisfaction

So let’s take a look at how this can be used in practice, taking the leading open source office productivity editor, OpenOffice, and the lesser known LibreOffice fork, as examples.

As mentioned in Part 1, the execution of the survey is critical here.  Without a proper, random survey of the market, the results will not be accurate.  In particular a survey of your current users will not work, since one of your goals is to find out what proportion of users are not familiar with your product.

So in this case I used Google’s new Consumer Survey service which uses sampling and post-stratification weighting to match the target population, which in this case was the US internet population.  In other words, the survey is weighted to reflect the population demographics, for age, sex, region of the country, urban versus rural,  income, etc.   I did this survey in a personal capacity for my own interest.  The Standard Disclaimer applies.

They survey question (and responses were):

What is your familiarity with the software application called “OpenOffice”?

  • I have never heard of it
  • I am aware of it but have never used it
  • I have tried it once
  • I use it only sometimes
  • I use it on a regular basis

With 1502 responses, the results were:

I have never heard of it 72.4%
I am aware of it but have never used it 9.3%
I have tried it once 5.7%
I use it only sometimes 5.9%
I use it on a regular basis 6.6%


And then with some simple arithmetic we have:

Customer Awareness 27.6%
Customer Motivation 65.9%
Customer Satisfaction 68.7%
Market Share 12.5%


What does that mean?  In plain English:

  • Around 1/4 of US internet users have heard of the OpenOffice software application.  That is the brand recognition.
  • Of those who have heard of OpenOffice, around 2/3 of them were sufficiently motivated to try the software.
  • And of those who tried OpenOffice 69% were sufficiently satisfied with the software that they continue to use it.
  • Overall, 1/8 of the surveyed population uses OpenOffice sometimes or regularly.

The absolute numbers are tricky to interpret in isolation.  More interesting is to look at the numbers over time.  The same survey question, with the same methodology was also given last September.  The results and the change are in the following table, with changes having statistical significance (90% confidence level) emphasized in bold.

 OpenOffice September 2012 April 2013 Change
Customer Awareness 24.3% 27.6% 14% growth
Customer Motivation 63.0% 65.9% 5% growth
Customer Satisfaction 70.6% 68.7% 3% decline
Market Share 10.8% 12.5% 16% growth


The Apache OpenOffice project should be gratified that their efforts have paid off, and awareness of the product is increasing, as well as market share.  This goes contrary to some loudly expressed concerns that the OpenOffice brand would languish at Apache.  Clearly this is not so.  The brand is growing, as well as the market share.

Since these factors are multiplicative, an increase in any one of them, or any combination of them, will grow the market share.  But it is probably easiest to grow the factor that is smallest today.  So looking to the future, increasing the awareness of the existence of OpenOffice would give the “biggest bang for the buck”.

For an entirely different view we can look at the same survey question and methodology, administered at the same times, only substituting the product name “LibreOffice” for “OpenOffice”.  Again, statistically significant changes are shown in bold.

 LibreOffice September 2012 April 2013 Change
Customer Awareness 10.7% 9.9% 7% decline
Customer Motivation 53.3% 66.7% 27% growth
Customer Satisfaction 73.7% 59.7% 19% decline
Market Share 4.2% 4.0% 5% decline


The brand recognition is not growing and is stuck at 10%.   The fact that in its third year of product availability the LibreOffice brand recognition has plateaued (if not declined) should be a concern.

But the more interesting thing here is the large increase in users trying LibreOffice (Motivation)  offset by the large decrease in users who continue to use the product (Satisfaction).  What does this mean?  Only the LibreOffice folks can say for certain, but this pattern is exactly what one would expect from a product where marketing has got ahead of quality.  It is like a movie that previews well, but suffers from bad reviews and poor sales after the first weekend.  Product development aims to make products that users want.  And marketing persuades users to try the product.  But where there is a disconnect between the two, where the product is not fulfilling the needs of those to whom it is being marketed, or (the same thing really) the product is being marketed to unsuitable users, this is what you see.

I should note that LibreOffice supporters like to blame their lack of success on not having the OpenOffice brand.  Yes, having a familiar brand is a nice thing to have, but the drop in Satisfaction for those trying LibreOffice is not a brand issue, since it is entirely among those who are already familiar with the LibreOffice brand.  Satisfaction is an attribute of the product, not due to brand.

Also, we can compare the metrics across products.  When we look at the most recent data OpenOffice clearly has an enormous lead in name recognition and market share, but also a large lead in Satisfaction.   69% of those who tried OpenOffice remained users, compared to 60% for those who attempted to use LibreOffice.    Keep your users satisfied and it is hard to go wrong.

Finally, and to reiterate up what I wrote earlier in my Scarcity Fallacy post, when you consider the position of Microsoft Office in this market, both products have a relatively small presence, with ample of room to grow, at Microsoft’s expense.  This is a great area to advance the cause of open source software, in a product category that almost every user needs.  There is no shortage of opportunity here, only a shortage of imagination.  Imagine if we combined the stability/quality and brand recognition of Apache OpenOffice with the enthusiastic marketing team of LibreOffice? (Combine our 50 million downloads with their 50 million press releases)  What if we combined the disciplined development approach of OpenOffice with LibreOffice ‘s talented developers?   Imagine what we could do?

Let’s admit it.  LibreOffice has plateaued.  They have their Linux desktop users, all 3% of the market that runs Linux on the desktop.  This market share was not earned.  These are not users that they won over.  These are users they got via the control their corporate sponsors have over Linux distributions.  They flipped a bit and instantly had that market share.   But their sponsors are Linux vendors that have little motivation to reach beyond that niche market.  (They certainly have little success doing so).   The opportunity for growth is not on the Linux desktop, unless the goal is to merely be a small fish in an even smaller pond.   Of course, LibreOffice could continue, and languish indefinitely as a pet project of a handful of Linux developers.   Or they could work with us at Apache, and satisfy the Linux users, but do so very much more as well.  This would also be a cost savings for LibreOffice’s corporate sponsors, no small factor in a world of declining PC sales.  The choice now, as it always has been, is theirs.

  • Tweet

Filed Under: Marketing, Open Source, OpenOffice

The Power of Brand and the Power of Product, Part 1

2013/05/13 By Rob 2 Comments

“Essentially, all models are wrong, but some are useful” said G. E.P. Box of Box-Jenkins fame.  Today we’re going to look at a model of market share, and I hope it is a useful model.  One nice property of it is that it is very easy to estimate the parameters of this model.  A single survey question will do.

This model should be intuitive to various groups, especially financial analysts and space enthusiasts.  The former might recall DuPont analysis of Return on Equity, by which ROE is expressed as a product of business ratios such as margin, turnover and leverage.   And space enthusiasts might recall the Drake equation, which estimates the number of intelligent civilizations in the galaxy, also as a product of various factors, such as the rate of star formation, and average number of planets per star.  Both models are useful, not only for estimating the value of interest, but because the factors themselves have interesting interpretations and tell us something about the system being modeled.

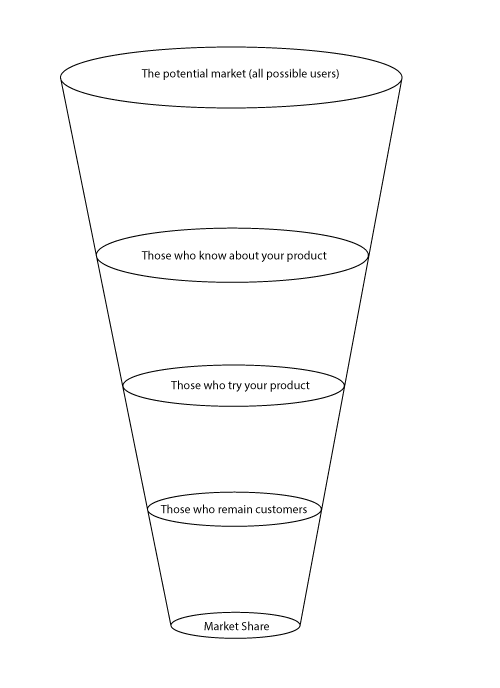
In our model we look at a funnel process that describes the actions that must occur for someone to become a regular user of a product.

market-funnel

We start with the universe of potential customers, everyone who might have a need for your product.

Then the person must be aware of your product. They need to know it exists.

(Note there are other models that start even earlier, that the potential customer must first be aware that they have a need.   For example, those selling medicines go through great lengths to convince people that flaky toe skin is something that requires urgent attention.)

Then the person must be convinced to try your product.   Even free products require some incentive for their time and effort. Why try?  Why now?  Is it safe?   Some will be motivated to try and some will not.

Of those who try, some will have a good experience and continue to use your product, and others will have a bad experience, or insufficiently good experience, and will not continue to use your product.

Those at the end of the funnel who continue to use your product, as a fraction of the total potential market at the top of the funnel, that is your market share.

Where it gets more interesting is when you express this as a product of factors, as in:

Market Share = Customer Awareness * Customer Motivation * Customer Satisfaction

Awareness tells you, of those who are in your market, what portion has heard of your product?  This is a measure of the value of your brand, including advertising and word of mouth.

Motivation tells you, of those who have heard of your product, what portion has even tried it?  This is a measure of the timeliness and fit of your product to the market.  Pricing strategy and promotions/incentives also factor in here.

Customer satisfaction tells you, of those who have tried your product, what portion remain customers?  This is a measure of how well your product meets the promises and expectations laid out in earlier stages of the funnel.

As you can see, the first two factors relate mostly to your brand and marketing efforts, while the last factor, Customer satisfaction, relates to your product.   So by identifying these individual factors you can look at the relative power of your brand and your product.  Do you have a great product that no one knows about?  If that were the case the awareness numbers would be low and the satisfaction numbers would be high.  Are you targeting the wrong users in your marketing efforts?   That would show up as high Motivation scores and low Satisfaction scores.  That could also indicate product quality issues.  There are many different combinations, and the values of these factors, and their trend over time, can tell you much.

Now here is where it gets interesting.   You can estimate all of these factors, Customer Awareness, Customer Motivation and Customer Satisfaction, and Market Share as well,  with a survey of a single question, a question that with responses that match the structure of your funnel.

The question to ask is of the form:

“What is your awareness with the hand cream called Whizzo-Soft?”

A. I have never heard of it.

B. I have heard of it but I have never tried it.

C. I have tried it once.

D. I use it sometimes.

E. I use it regularly.

There are variations on the scale to use, sometimes only four choices, sometimes more, depending on whether you want to make distinctions among occasional versus regular customers.

Note that this requires a real, random survey of your target market.  A poll on your website where visitors self-select will obviously bias the results.   For this to work you really need to survey a random sample of your target market.

Once you have done this the math is easy.  If you have N total responses , and the number of responses for the questions are A ,B, C, D and E, then:

  • Customer Awareness = 1 – A/N
  • Customer Motivation = (C + D + E) / (N -A)
  • Customer Satisfaction = (D + E)/(N – A – B)

In Part 2 of this post, I’ll show a worked out example, including interpretation,  using data from a  recent random survey that looked at OpenOffice and LibreOffice awareness and use.

  • Tweet

Filed Under: Marketing

Primary Sidebar

Copyright © 2006-2023 Rob Weir · Site Policies


Loading Comments...