“Essentially, all models are wrong, but some are useful” said G. E.P. Box of Box-Jenkins fame. Today we’re going to look at a model of market share, and I hope it is a useful model. One nice property of it is that it is very easy to estimate the parameters of this model. A single survey question will do.
This model should be intuitive to various groups, especially financial analysts and space enthusiasts. The former might recall DuPont analysis of Return on Equity, by which ROE is expressed as a product of business ratios such as margin, turnover and leverage. And space enthusiasts might recall the Drake equation, which estimates the number of intelligent civilizations in the galaxy, also as a product of various factors, such as the rate of star formation, and average number of planets per star. Both models are useful, not only for estimating the value of interest, but because the factors themselves have interesting interpretations and tell us something about the system being modeled.
In our model we look at a funnel process that describes the actions that must occur for someone to become a regular user of a product.
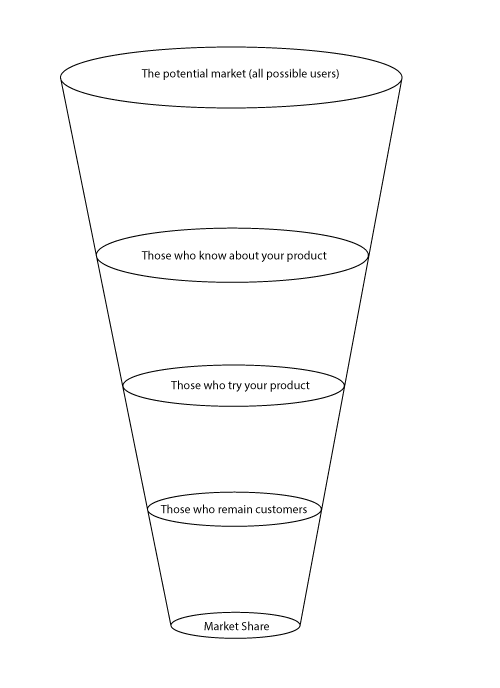
We start with the universe of potential customers, everyone who might have a need for your product.
Then the person must be aware of your product. They need to know it exists.
(Note there are other models that start even earlier, that the potential customer must first be aware that they have a need. For example, those selling medicines go through great lengths to convince people that flaky toe skin is something that requires urgent attention.)
Then the person must be convinced to try your product. Even free products require some incentive for their time and effort. Why try? Why now? Is it safe? Some will be motivated to try and some will not.
Of those who try, some will have a good experience and continue to use your product, and others will have a bad experience, or insufficiently good experience, and will not continue to use your product.
Those at the end of the funnel who continue to use your product, as a fraction of the total potential market at the top of the funnel, that is your market share.
Where it gets more interesting is when you express this as a product of factors, as in:
Market Share = Customer Awareness * Customer Motivation * Customer Satisfaction
Awareness tells you, of those who are in your market, what portion has heard of your product? This is a measure of the value of your brand, including advertising and word of mouth.
Motivation tells you, of those who have heard of your product, what portion has even tried it? This is a measure of the timeliness and fit of your product to the market. Pricing strategy and promotions/incentives also factor in here.
Customer satisfaction tells you, of those who have tried your product, what portion remain customers? This is a measure of how well your product meets the promises and expectations laid out in earlier stages of the funnel.
As you can see, the first two factors relate mostly to your brand and marketing efforts, while the last factor, Customer satisfaction, relates to your product. So by identifying these individual factors you can look at the relative power of your brand and your product. Do you have a great product that no one knows about? If that were the case the awareness numbers would be low and the satisfaction numbers would be high. Are you targeting the wrong users in your marketing efforts? That would show up as high Motivation scores and low Satisfaction scores. That could also indicate product quality issues. There are many different combinations, and the values of these factors, and their trend over time, can tell you much.
Now here is where it gets interesting. You can estimate all of these factors, Customer Awareness, Customer Motivation and Customer Satisfaction, and Market Share as well, with a survey of a single question, a question that with responses that match the structure of your funnel.
The question to ask is of the form:
“What is your awareness with the hand cream called Whizzo-Soft?”
A. I have never heard of it.
B. I have heard of it but I have never tried it.
C. I have tried it once.
D. I use it sometimes.
E. I use it regularly.
There are variations on the scale to use, sometimes only four choices, sometimes more, depending on whether you want to make distinctions among occasional versus regular customers.
Note that this requires a real, random survey of your target market. A poll on your website where visitors self-select will obviously bias the results. For this to work you really need to survey a random sample of your target market.
Once you have done this the math is easy. If you have N total responses , and the number of responses for the questions are A ,B, C, D and E, then:
- Customer Awareness = 1 – A/N
- Customer Motivation = (C + D + E) / (N -A)
- Customer Satisfaction = (D + E)/(N – A – B)
In Part 2 of this post, I’ll show a worked out example, including interpretation, using data from a recent random survey that looked at OpenOffice and LibreOffice awareness and use.
[…] The Power of Brand and the Power of Product, Part 1 […]