• Skip to primary navigation
  • Skip to main content
  • Skip to primary sidebar

An Antic Disposition

  • Home
  • About
  • Archives
  • Writings
  • Links
You are here: Home / Archives for Rob

Rob

The New Technology Consumers

2014/01/12 By Rob 1 Comment

There were those who complained about the labor conditions of those who picked grapes and sewed t-shirts.  About pesticides on apples and growth hormones in milk.  About generically modified corn and soy.  About how governments conduct foreign policy, how they treat prisoners of war,  how they collect intelligence, how they make treaties and how they make war.

How dare mere consumers, the unwashed masses, the hoi poloi have an opinion on such matters?  Let those who know best determine what is in the public good.

I see open source and open standards activists in a similar way.  Many consumers care not only in the direct good they receive from technology, but also in how that good was generated, whether from exploitative sweat labor, whether from environmentally invasive  methods, and yes, whether by perpetuating software monopolies or damaging the ecosystem of open source and open standards.

What we’re seeing is a generation arising that is no longer content to worship at the alter of technology and follow the dictates of the high priests.  They are not content to be fed whatever the industry gives them.  They care not only about what something is and how it is used, but also what is its impact on their bodies, the environment, on culture and society.

To those who are unprepared this may appear confusing, irrational and even scary.  Why aren’t the consumers content to accept our recommendations?  Why are they complaining so much?  For some kinds of business, those who do not adapt, this is a threat.  And to others, this is an opportunity.  Some will win and some will lose.  Which will you be?

  • Tweet

Filed Under: Open Source, Standards

Apache OpenOffice 2013 Mailing List Review

2013/12/18 By Rob 1 Comment

I did a quick study of the 2013 mailing list traffic for the Apache OpenOffice project.  I looked at all project mailing lists, including native language lists.  I omitted the purely transactional mailing lists, the ones that merely echo code check-ins and bug reports.  Altogether 14 mailing lists were included in this study.

In 2013 the OpenOffice community mailing lists saw 24,423 posts from 2,211 unique posters, in 4,819 threads.

A word cloud of the most frequent words in post titles (thanks to Jonathan Feinberg’s Wordle app) follows.  As you can see, the terms used in the Propose/Approve/Code/Test/Release workflow rise to the top.  That shows the project’s focus.Word Cloud of words in post titles

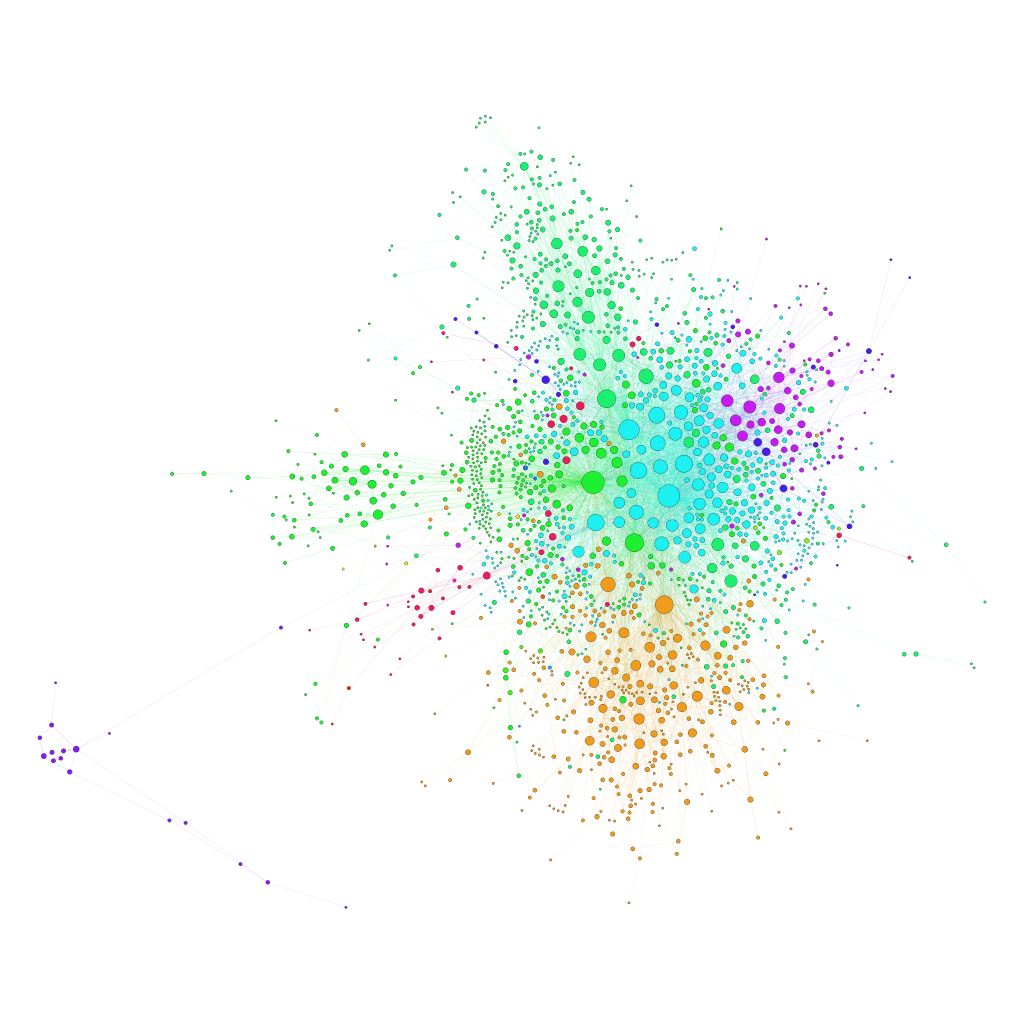
I thought it would also be interesting to look at this from a social network perspective, looking at the atomic units of collaboration on a mailing list:  responding to a post.  Of course, not all posts involve a response.  It is common for someone to post information, not requiring or expecting a response.   But there are many responses.  As mentioned above, there were 24,423 posts in 4,819 threads, so an average of 4 responses per post.  We can represent this as a directed graph, with each poster treated as a node, and a directed arc to each responder node from the node of the original post author.  (This might seem backwards, and you could argue for reversing the arcs, but in general in mailing lists the responder is providing value to the original poster, so the centrality  of the responder will be more relevant.  Consider, for example, the questions coming from random users, and the experienced project members who answer them.)

Forming a graph in this way gives us a giant component (representing 98.84% of the whole graph) with 1,955 nodes and 7,069 arcs.   Average degree (number of collaboration partners for each person) is 3.6.  46 people responded to more than 50 other people.  Maximum degree is 714 (Apache OpenOffice V.P. Andrea Pescetti).  A visualization of this graph, using the open source Gephi) follows.  You can click on the image for a larger version.  Nodes have been scaled to reflect betweenness centrality (a measure the degree to which a node helps connect others into the graph) and colored via a modularity algorithm which finds sets of nodes that have a high degree of interconnection.

You should click on the graph to see the full-size version.

What a marvelous, large and complex project we have in Apache OpenOffice!

OpenOffice mailing list response graph

  • Tweet

Filed Under: Uncategorized

IBM Support for Apache OpenOffice

2013/11/04 By Rob 2 Comments

As you probably know, IBM has been involved with the OpenOffice.org community for many years.   This included collaboration on ODF and accessibility at first, as we worked on our separate Lotus Symphony fork.  And then in 2011 we followed the OpenOffice.org community to Apache where Apache OpenOffice then took off.  Since then we’ve been merging in features and bug fixes from Symphony, essentially ending the Symphony fork.   The first results of this collaboration showed up in Apache OpenOffice 4.0, with the new side panel UI.  The reception of this new release has been phenomenal.    The release received great reviews, including an 2013 InfoWord Best of Open Source (Bossie) award.  The success of this release propelled us to recently hit a new download milestone:  Over 75 million copies of Apache OpenOffice in the less than 18 months since the first release of Apache OpenOffice.

The overall market for office productivity suites is changing.   Microsoft Office 2003 is hitting End of Life in April 2014, causing companies still using it to explore other options.  The introduction of new subscription models from Microsoft, as well as emergence of new cloud-based editors from several players, including IBM, are also making customers reevaluate their dependency on Microsoft Office.  Do we really need Office?  For everyone?  What are the alternatives?

I’m really pleased to see other parts of IBM starting to see the opportunities available with Apache OpenOffice.   Already publicly announced include integrations with IBM Connections, IBM SmartCloud and IBM ECM and Case Manager.  (If there are other IBM products that you think would benefit greatly from integration, let me know!)

The latest, and most significant, enabler of enterprise use of Apache OpenOffice is our IBM Support for Apache OpenOffice offering.  Although individual end-users and even small businesses can easily deploy Apache OpenOffice on their own (75 million downloads testifies to that), larger enterprises with more complicated and demanding needs benefit from the kind of expertise that IBM can provide.   So I’m glad to see this offering available to fill out the ecosystem, so everyone can use and be successful with Apache OpenOffice, from individual university students, to small non-profits, to large international corporations.

  • Tweet

Filed Under: IBM, Open Source, OpenOffice

The Power of Brand and the Power of Product, Part 3

2013/10/21 By Rob Leave a Comment

In the previous two parts (one and two) I described a model of product adoption and market share that could be built with a single survey question.   I applied this model to the open source productivity suites OpenOffice and LibreOffice, looking at adoption in September 2012 and April 2013.

The results were described in detail in the previous article in this series, but can be summarized as:

 OpenOffice September 2012 April 2013 Change
Customer Awareness 24.3% 27.6% 14% growth
Customer Motivation 63.0% 65.9% 5% growth
Customer Satisfaction 70.6% 68.7% 3% decline
Market Share 10.8% 12.5% 16% growth


Six months have now passed and it is worth taking another look to see how things have evolved.  As I did previously, I used Google’s  Consumer Survey service which uses sampling and post-stratification weighting to match the target population, which in this case was the US internet population.  In other words, the survey is weighted to reflect the population demographics, for age, sex, region of the country, urban versus rural,  income, etc.   I did this survey in a personal capacity for my own interest.  The Standard Disclaimer applies.

OpenOffice (N=1519) September 2012 April 2013 September 2013 Change (September to September)
Customer Awareness 24.3% 27.6% 30.7% 26% growth
Customer Motivation 63.0% 65.9% 67.4% 7% growth
Customer Satisfaction 70.6% 68.7% 77.8% 10% growth
Market Share 10.8% 12.5% 16.1% 49% growth


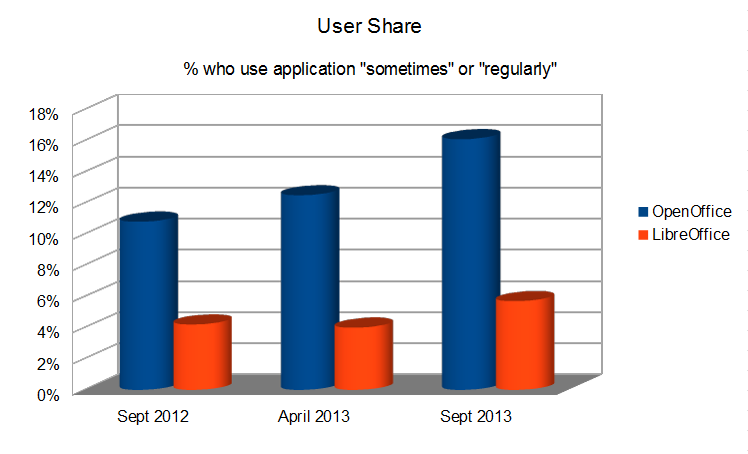
So what do we see?  Very nice results, indeed.  The OpenOffice brand is strong and growing.  Over 30% of consumers surveyed had heard of it.  Of those who had heard of it, 67% had given it a try.  That number is changed little.  This is an opportunity for Apache OpenOffice marketing volunteers to improve both of these numbers.  Of those who tried OpenOffice almost 78% continued to use OpenOffice.  This is a modest increase, but there is certainly room to improve here.   Put it altogether, and the estimated user share, the percentage of US internet users who use OpenOffice “sometimes” or “regularly” is 16.1%, nearly a 50% improvement year-over-year.

In any case, to summarize and to illustrate the improvements graphically, I’ve charted the growth in user share over the three surveys, including results for LibreOffice as well:

use-survey-sept-2013

  • Tweet

Filed Under: Apache, Marketing, Open Source, OpenOffice

Visualizing OASIS Technical Committees

2013/07/01 By Rob 1 Comment

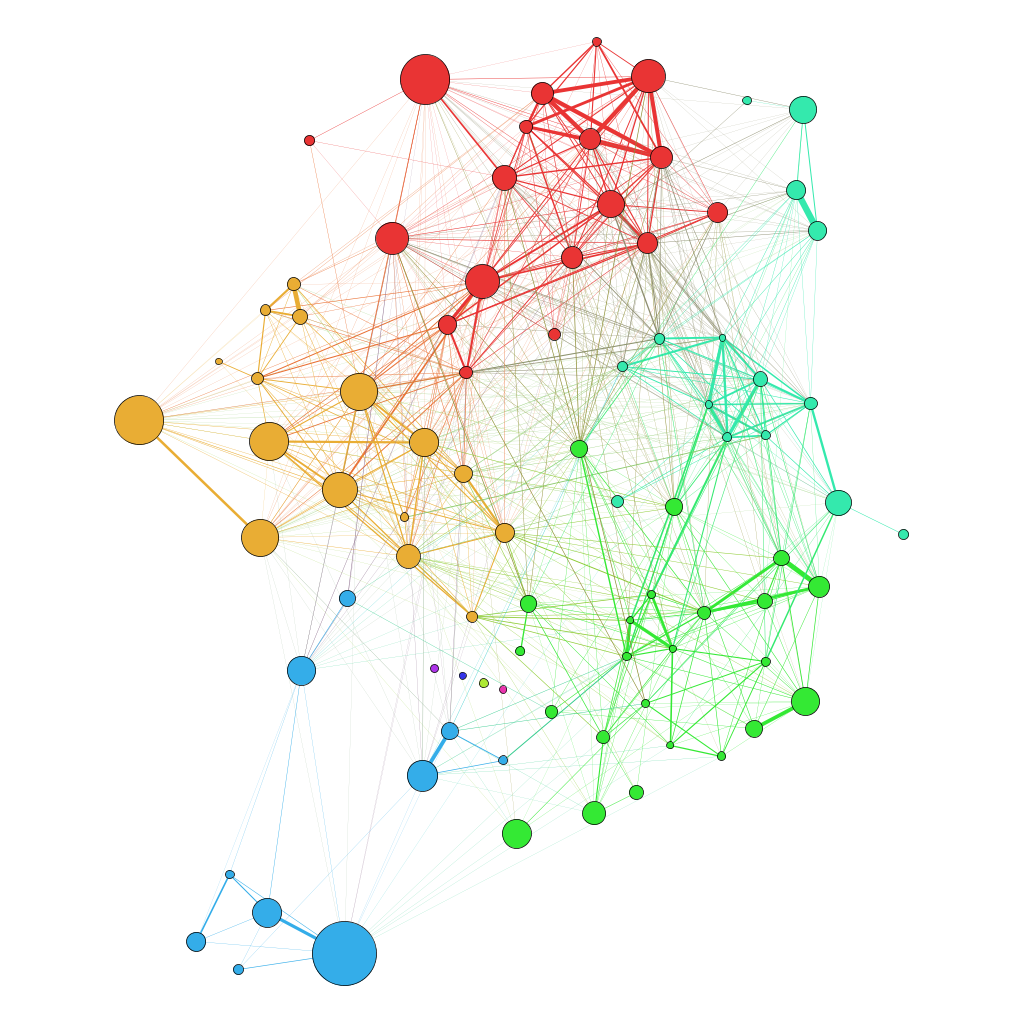
oasis

So what do we have here?  This is a simple social network visualization, of OASIS Technical Committees.  Each circle in this graph represents a single Technical Committee (TC).  The size of the circle is proportionate to how many members are on the committee.  The lines between the committees have a weight that is proportionate to the overlap in membership between the TCs.  In this case I used Dice’s coefficient as a metric, although any of the several set similarity metrics (Jaccard, etc.) would work here.  The color of each node represents the modularity class, a measure of communities or sub-networks within the graph.  The resulting graph was then run through Gephi and its Force Atlas layout algorithm ,  which brings together the TCs that are more closely related by overlapping membership.   Click the image for a larger version.

(For those who are interested, the raw data for this is all publicly available,  on the OASIS website.  Scraping the webpages for the data, calculating the graph and outputting a GEXF format file for Gephi was accomplished in 133 lines of Python.)

Note one important fact:  the graph is formed entirely on abstract concepts, the size of each committee and the overlaps in membership.  It has no knowledge of what the underlying technologies are, the companies and individuals involved, or of other items of semantic value that could describe the work of the committee.   The structure is essentially based on the interests and affiliations of individual committee members.  Where there is common interest it is assumed that there is commonality in the work of the TCs.

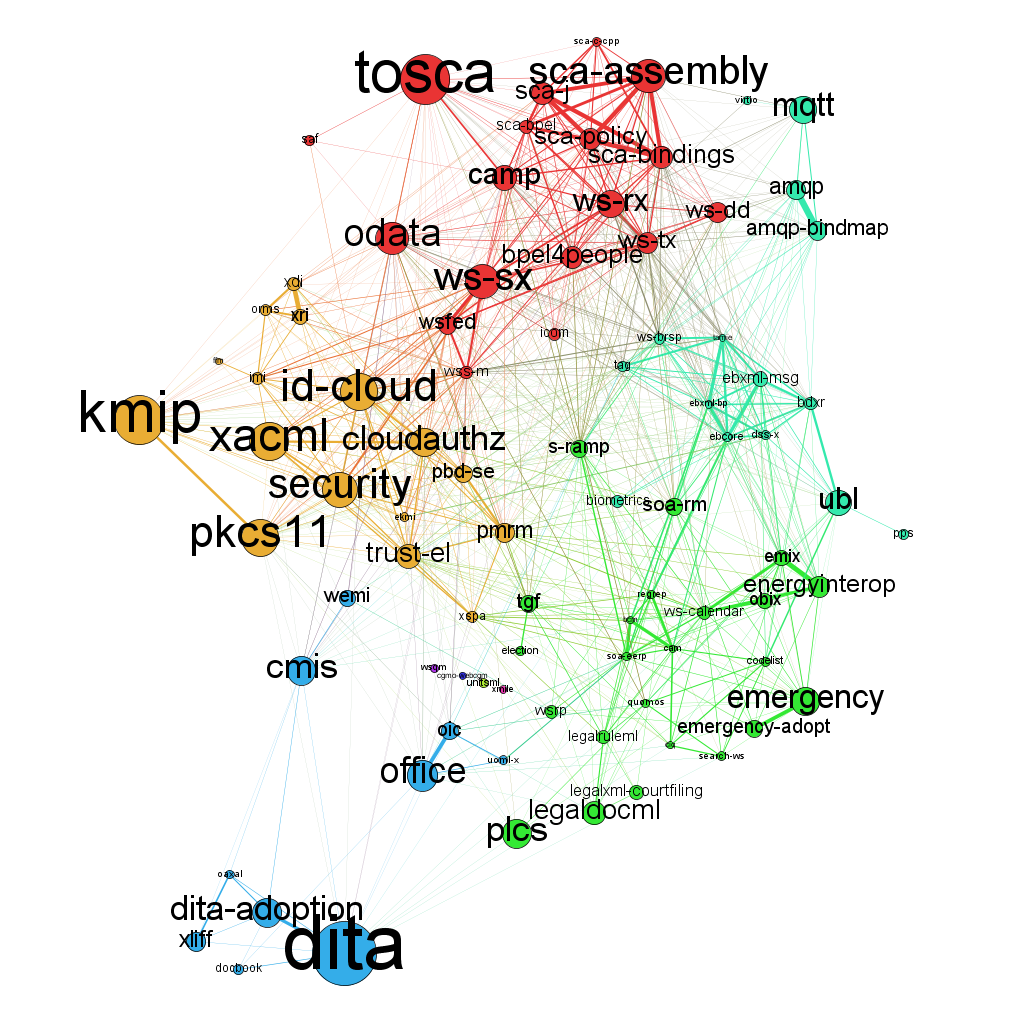
So how well does this match reality?   The image that follows (click for an enlarged version) is the same chart, but with each node labeled by the short name of the TC.    As you can see, the above approach does a fine job bringing together related TCs.  This occurs both at the fine-grained level, where the DITA TC and the DITA Adoption TC, or the SCA and SCA Assembly TCs are adjacent, and it also applies at the broader level, where we see communities for content-related standards, for privacy/identity standards, legal/emergency, etc.

oasis-projects

  • Tweet

Filed Under: OASIS, Social Network Analysis

  • « Go to Previous Page
  • Go to page 1
  • Go to page 2
  • Go to page 3
  • Go to page 4
  • Go to page 5
  • Go to page 6
  • Interim pages omitted …
  • Go to page 69
  • Go to Next Page »

Primary Sidebar

Copyright © 2006-2023 Rob Weir · Site Policies


Loading Comments...