• Skip to primary navigation
  • Skip to main content
  • Skip to primary sidebar

An Antic Disposition

  • Home
  • About
  • Archives
  • Writings
  • Links
You are here: Home / Archives for 2014

Archives for 2014

ODF 1.2 Submitted to ISO

2014/03/31 By Rob 8 Comments

Last Wednesday, March 26th, on Document Freedom Day, OASIS submitted Open Document Format 1.2 standard to the ISO/IEC JTC1 Secretariat for transposition to an International Standard under the Publicly Available Specification (PAS) procedure.

If you recall, the PAS procedure is what we used back in 2005 when ODF 1.0 was submitted to ISO and was approved as ISO/IEC 26300.  ODF 1.1 used a different procedure and was processed as an amendment to ISO/IEC 26300.  Since ODF 1.2 is a much larger delta to the previous version it makes sense to take it through the PAS procedure again.

The PAS transposition process starts with a two month “translation period” when National Bodies may translate the ODF 1.2 specification if they wish.  This is then followed by a three-month ballot.   Following a successful ballot any comments received are reviewed by all stakeholders and resolutions determined at a Ballot Resolution Meeting (BRM).

I am notoriously bad at predicting the pace of standards development, but if you add up the steps of the process, this looks like a ballot ending in Q4 and a BRM around year’s end.
  • Tweet

Filed Under: OASIS, ODF, Standards

The Words Democrats and Republicans Use

2014/02/07 By Rob Leave a Comment

It came to me after listening to the State of the Union Address:   Can we tell whether a speech was from a Democrat or a Republican President, purely based on metrics related to the words used?  It makes sense that we could.  After all, we can analyze emails and detect spam that way.  Automatic text classification is a well known problem.   On the other hand, presidential speeches go back quite a bit.  Is there a commonality of speeches of, a Democrat in 2014 with one from 1950?  Only one way to find out…

I decided to limit myself to State of the Union (SOTU) addresses, since they are readily available, and only those post WW II.  There has been a significant shift in American politics since WW II so it made sense, for continuity, to look at Truman and later.   If I had included all of Roosevelt’s twelve (!) SOTU speeches it might have distorted the results, giving undue weight to individual stylistic factors.   So I grabbed the 71 post WWII addresses and stuck them into a directory.  I included only the annual addresses, not any exceptional ones, like G.W. Bush’s special SOTU in September 2001.

I then used R’s text mining package, tm, to load the files into a corpus, tokenize, remove punctuation, stop words, etc.  I then created a document-term matrix and removed any terms that occurred in fewer than half of the speeches.  This left me with counts of 610 terms in 71 documents.

Then came the fun part.  I decided to use Pointwise Mutual Information (PMI),  an information-centric measure of association from information retrieval, to look at the association between terms in the speeches and party affiliation.  PMI shows the degree of association (or “co-location”) of two terms while also accounting for their prevalence of the terms individually.  Wikipedia gives the formula, which is pretty much what you would expect.   Calculate the log probability of the co-location and subtract out the log probability of the background rate of the term.  But instead of looking at the co-occurrence of two terms, I tried looking at the co-occurrence of terms with the party affiliation.    For example, the PMI of “taxes” with the class Democrat would be:  log p(“taxes”|Democrat) – log p(“taxes”).  You can see my full script for the gory details.

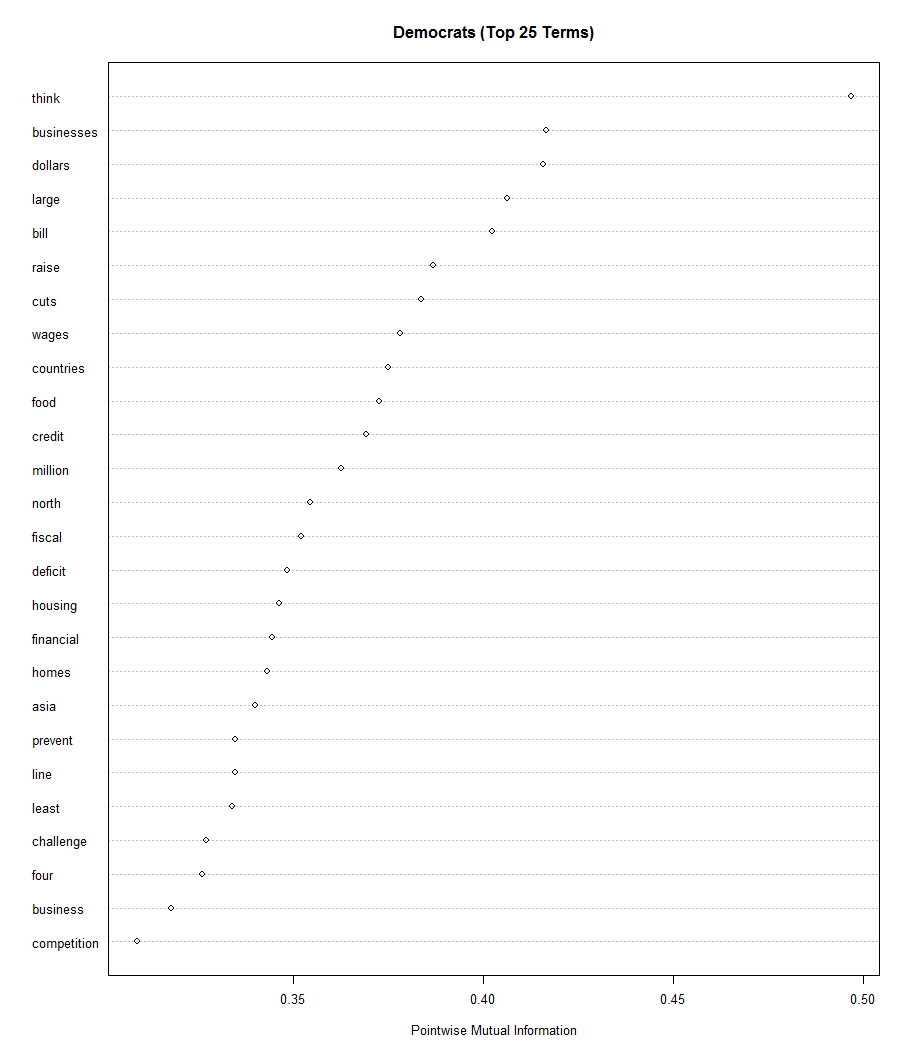
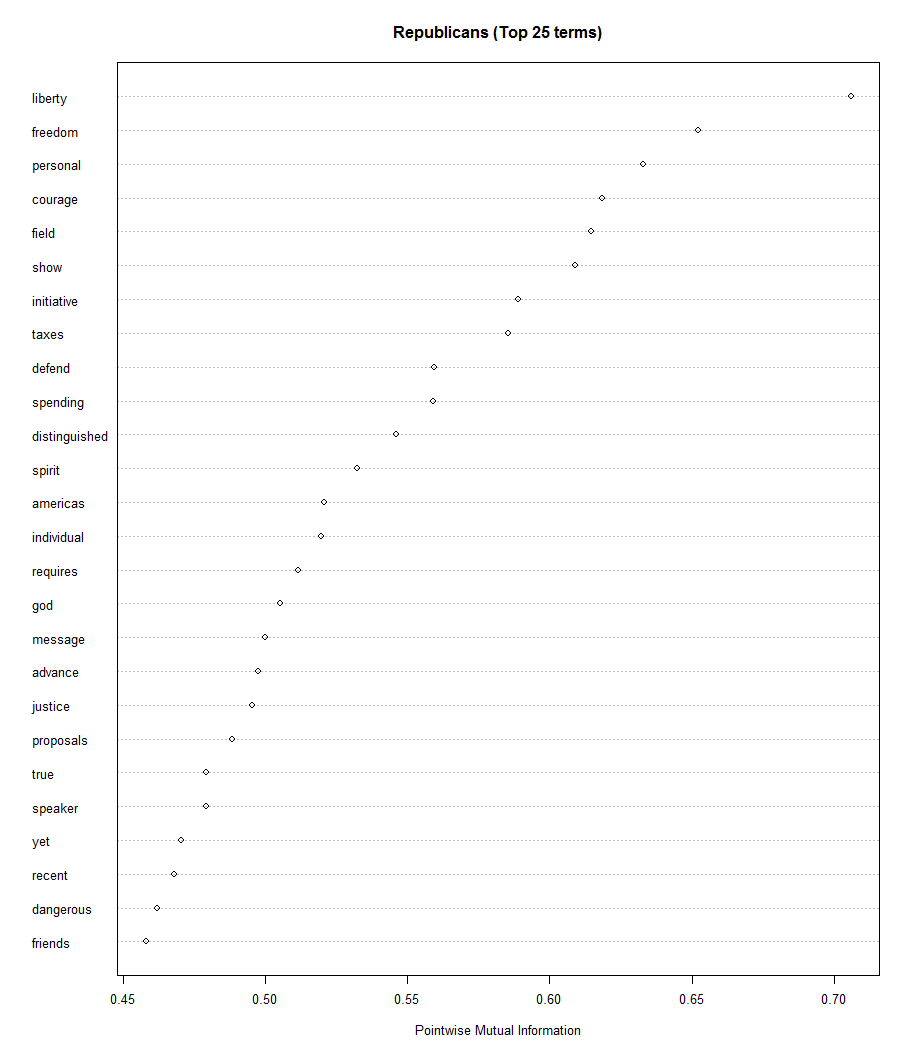
Here’s what I got, listing the 25 highest PMI terms for Democrats and Republicans:

So what does this all mean?  First note the difference in scale.  The top Republican terms had higher PMI than the top Democrat terms.  In some sense it is a political Rorschach test.  You’ll see what you want to see.  But in fairness to both parties I think this does accurately reflect their traditional priorities.

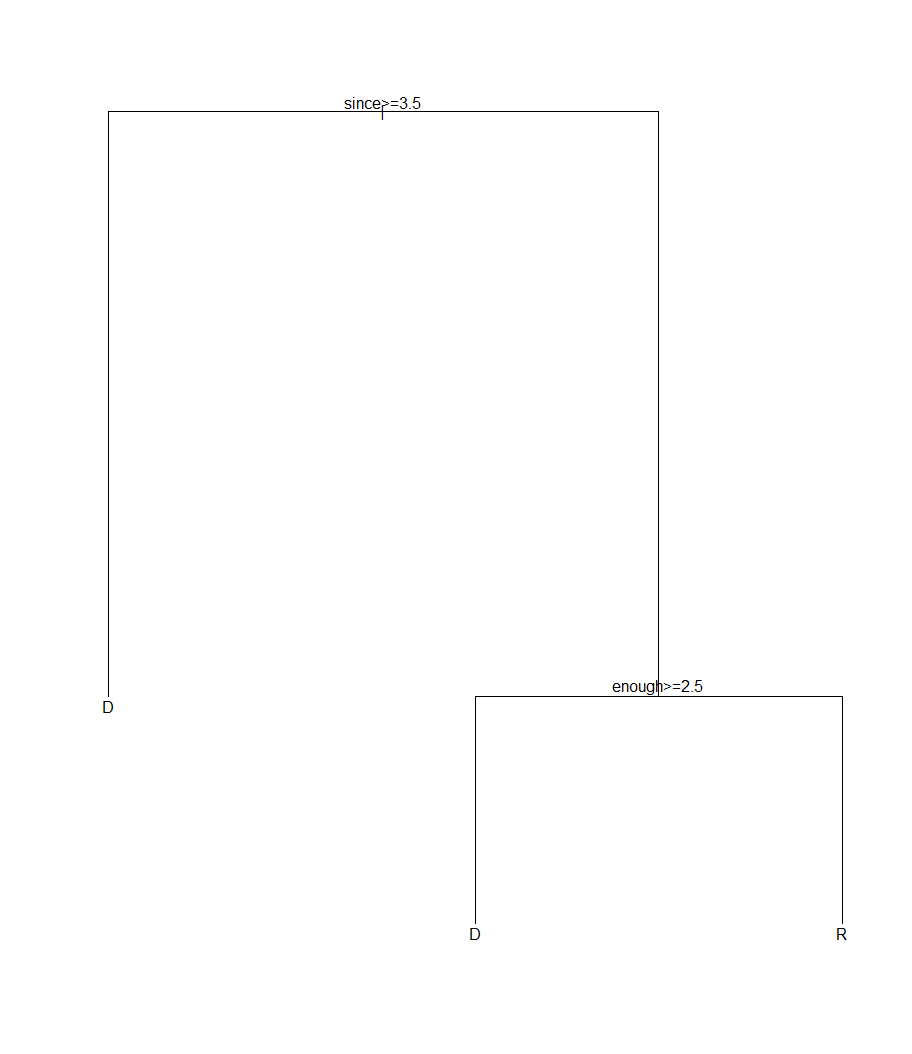
From the analytic standpoint the interesting thing I notice is how this compares to other approaches, like using classification trees.  For example, if I train the original data with a recursive partitioning classification tree, using rpart, I can classify the speeches with 86% accuracy by looking at the occurrences of only two terms:

Not a lot of insight there. It essentially latched on to background noise and two semantically useless words.   So I prefer the PMI-based results since they appear to have more semantic weight.

Next steps: I’d like to apply this approach back to speeches from 1860 through 1945.

  • Tweet

Filed Under: Language, R

First Move Advantage in Chess

2014/01/27 By Rob 8 Comments

The Elo Rating System

Competitive chess players, at the amateur club level all the way through the top grandmasters, receive ratings based on their performance in games.   The ratings formula in use since 1960 is based on a model first proposed by the Hungarian-American physicist Arpad Elo.  It uses a logistic equation to estimate the probability of a player winning as a function of that player’s rating advantage over his opponent:

E = \frac 1 {1 + 10^{-\Delta R/400}}

So for example, if you play an opponent who out-rates you by 200 points then your chances of winning are only 24%.

After each tournament, game results are fed back to a national or international rating agency and the ratings adjusted.  If you scored better than expected against the level of opposition played your rating goes up.  If you did worse it goes down.  Winning against an opponent much weaker than you will lift your rating little.  Defeating a higher-rated opponent will raise your rating more.

That’s the basics of the Elo rating system, in its pure form.  In practice it is slightly modified, with ratings floors, bootstrapping new unrated  players, etc.  But that is its essence.

Measuring the First Mover Advantage

It has long been known that the player that moves first, conventionally called “white”, has a slight advantage, due to their ability to develop their pieces faster and their greater ability to coax the opening phase of the game toward a system that they prefer.

So how can we show this advantage using a lot of data?

I started with a Chessbase database of  1,687,282 chess games, played from 2000-2013.   All games had a minimum rating of 2000 (a good club player).  I excluded all computer games.   I also excluded 0 or 1 move games, which usually indicate a default (a player not showing up for an assigned game) or a bye.  I exported the games to PGN format and extracted the metadata for each game to a CSV file via a python script.  Additional processing was then done in R.

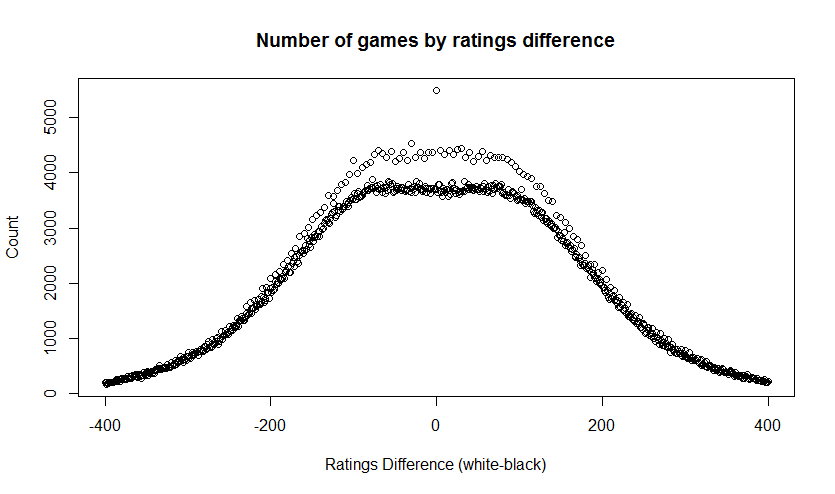
Looking at the distribution of ratings differences (white Elo-black Elo) we get this.  Two oddities to note.  First note the excess of games with a ratings difference of exactly zero.  I’m not sure what caused that, but since only 0.3% of games had this property, I ignored it.   Also there is clearly a “fringe” of excess counts for ratings that are exactly multiples of 5.  This suggests some quantization effect in some of the ratings, but should not harm the following analysis.


The collection has results of:

  • 1-0 (36.4%)
  • 1/2-1/2 (35.5%)
  • 0-1 (28.1%)

So the overall score, from white’s perspective was 54.2% (counting a win as 1 point and a draw as 0.5 points).

So white as a 4.2% first move advantage, yes?  Not so fast.   A look at the average ratings in the games shows:

  • mean white Elo: 2312
  • mean black Elo: 2309

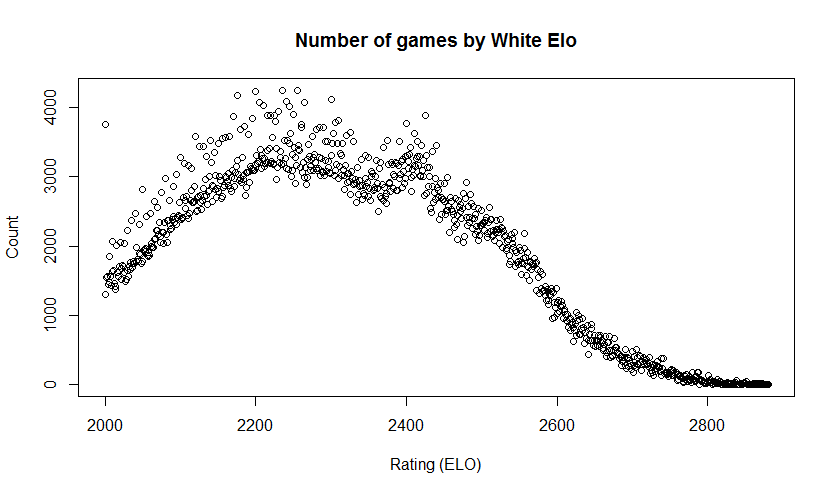
So on average white was slightly higher rated than black in these games.  A t-test indicated that the difference in means was significant to the 95% confidence level.  So we’ll need to do some more work to tease out the actual advantage for white.

Looking for a Performance Advantage

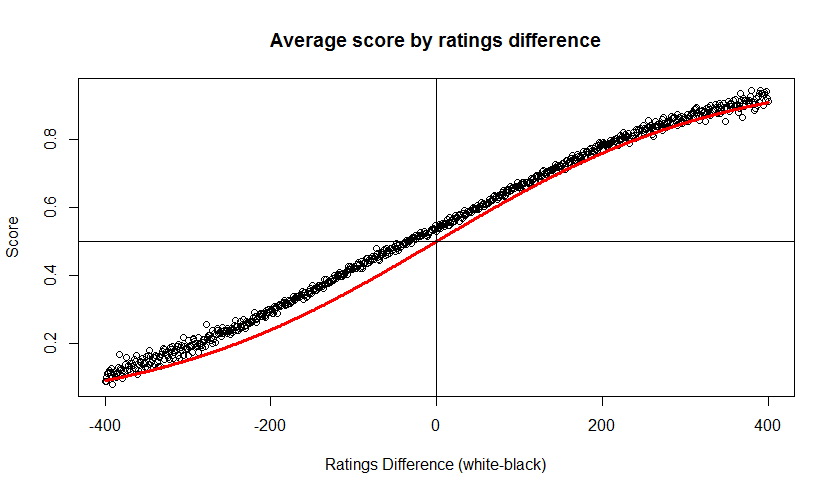
I took the data and binned it by ratings difference, from -400 to 400, and for each difference I calculated the expected score, per the Elo formula, and the average actual score in games played with that ratings difference.   The following chart shows the black circles for the actual scores and a red line for the predicted score.  Again, this is from white’s perspective.   Clearly the actual score is above the expected score for most of the range.   In fact white appears evenly matched even when playing against an opponent 35-points higher.

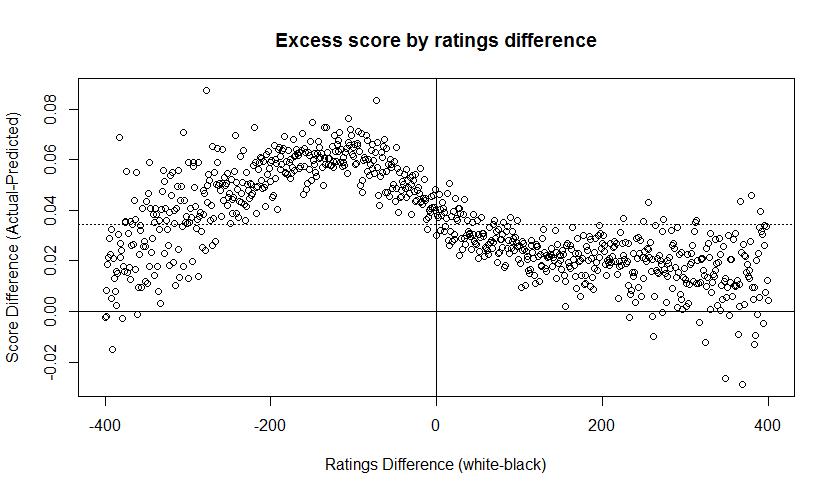
The trend is a bit clearer of we look at the “excess score”, the amount by which white’s results exceed the expected results.  In the following chart the average excess score is indicated by a dotted line at y=0.034.  So the average performance advantage for white, accounting for the strength of opposition, was around 3.4%.  But note how the advantage is strongest where white is playing a slightly stronger player.

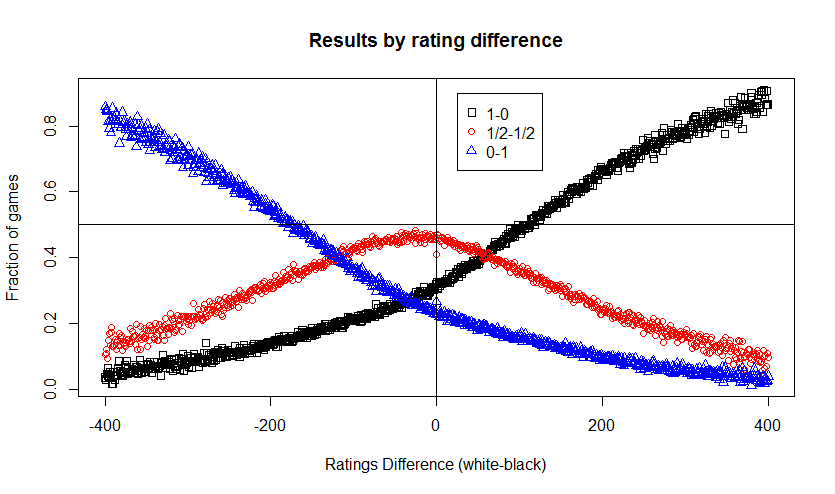
Finally I looked at the actual game results, the distribution of wins, draws and losses, by ratings differences.  The Elo formula doesn’t speak to this.  It deals with expected scores.  But in the real world one cannot score 0.8 in a game.   There are only three options:  win, draw or lose.  In this chart you see the first mover advantage in another way.  The entire range of outcomes is essentially shifted over to the left by 35 points.

  • Tweet

Filed Under: Chess, R Tagged With: Chess

The New Technology Consumers

2014/01/12 By Rob 1 Comment

There were those who complained about the labor conditions of those who picked grapes and sewed t-shirts.  About pesticides on apples and growth hormones in milk.  About generically modified corn and soy.  About how governments conduct foreign policy, how they treat prisoners of war,  how they collect intelligence, how they make treaties and how they make war.

How dare mere consumers, the unwashed masses, the hoi poloi have an opinion on such matters?  Let those who know best determine what is in the public good.

I see open source and open standards activists in a similar way.  Many consumers care not only in the direct good they receive from technology, but also in how that good was generated, whether from exploitative sweat labor, whether from environmentally invasive  methods, and yes, whether by perpetuating software monopolies or damaging the ecosystem of open source and open standards.

What we’re seeing is a generation arising that is no longer content to worship at the alter of technology and follow the dictates of the high priests.  They are not content to be fed whatever the industry gives them.  They care not only about what something is and how it is used, but also what is its impact on their bodies, the environment, on culture and society.

To those who are unprepared this may appear confusing, irrational and even scary.  Why aren’t the consumers content to accept our recommendations?  Why are they complaining so much?  For some kinds of business, those who do not adapt, this is a threat.  And to others, this is an opportunity.  Some will win and some will lose.  Which will you be?

  • Tweet

Filed Under: Open Source, Standards

  • « Go to Previous Page
  • Go to page 1
  • Go to page 2

Primary Sidebar

Copyright © 2006-2023 Rob Weir · Site Policies