The Elo Rating System
Competitive chess players, at the amateur club level all the way through the top grandmasters, receive ratings based on their performance in games. The ratings formula in use since 1960 is based on a model first proposed by the Hungarian-American physicist Arpad Elo. It uses a logistic equation to estimate the probability of a player winning as a function of that player’s rating advantage over his opponent:
$latex E = \frac 1 {1 + 10^{-\Delta R/400}}&s=3$
So for example, if you play an opponent who out-rates you by 200 points then your chances of winning are only 24%.
After each tournament, game results are fed back to a national or international rating agency and the ratings adjusted. If you scored better than expected against the level of opposition played your rating goes up. If you did worse it goes down. Winning against an opponent much weaker than you will lift your rating little. Defeating a higher-rated opponent will raise your rating more.
That’s the basics of the Elo rating system, in its pure form. In practice it is slightly modified, with ratings floors, bootstrapping new unrated players, etc. But that is its essence.
Measuring the First Mover Advantage
It has long been known that the player that moves first, conventionally called “white”, has a slight advantage, due to their ability to develop their pieces faster and their greater ability to coax the opening phase of the game toward a system that they prefer.
So how can we show this advantage using a lot of data?
I started with a Chessbase database of 1,687,282 chess games, played from 2000-2013. All games had a minimum rating of 2000 (a good club player). I excluded all computer games. I also excluded 0 or 1 move games, which usually indicate a default (a player not showing up for an assigned game) or a bye. I exported the games to PGN format and extracted the metadata for each game to a CSV file via a python script. Additional processing was then done in R.
Looking at the distribution of ratings differences (white Elo-black Elo) we get this. Two oddities to note. First note the excess of games with a ratings difference of exactly zero. I’m not sure what caused that, but since only 0.3% of games had this property, I ignored it. Also there is clearly a “fringe” of excess counts for ratings that are exactly multiples of 5. This suggests some quantization effect in some of the ratings, but should not harm the following analysis.
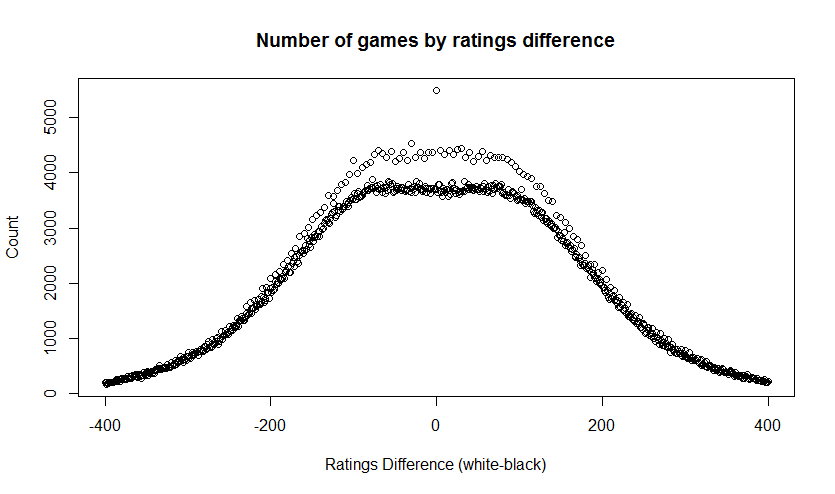
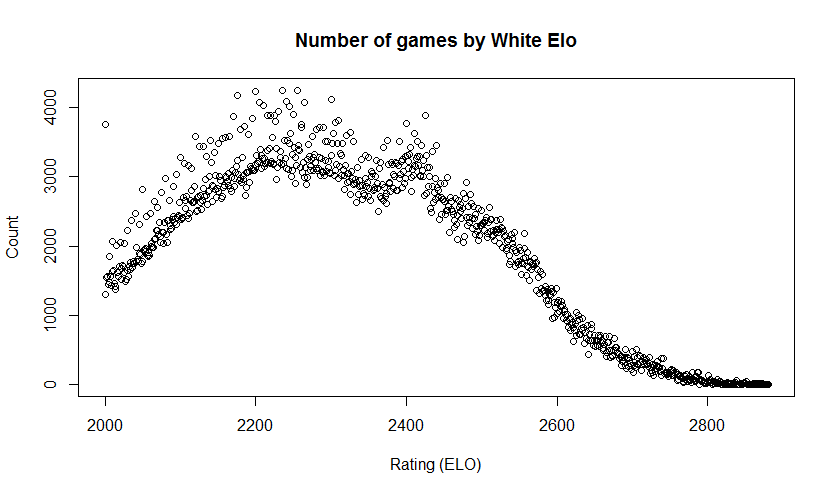
The collection has results of:
- 1-0 (36.4%)
- 1/2-1/2 (35.5%)
- 0-1 (28.1%)
So the overall score, from white’s perspective was 54.2% (counting a win as 1 point and a draw as 0.5 points).
So white as a 4.2% first move advantage, yes? Not so fast. A look at the average ratings in the games shows:
- mean white Elo: 2312
- mean black Elo: 2309
So on average white was slightly higher rated than black in these games. A t-test indicated that the difference in means was significant to the 95% confidence level. So we’ll need to do some more work to tease out the actual advantage for white.
Looking for a Performance Advantage
I took the data and binned it by ratings difference, from -400 to 400, and for each difference I calculated the expected score, per the Elo formula, and the average actual score in games played with that ratings difference. The following chart shows the black circles for the actual scores and a red line for the predicted score. Again, this is from white’s perspective. Clearly the actual score is above the expected score for most of the range. In fact white appears evenly matched even when playing against an opponent 35-points higher.
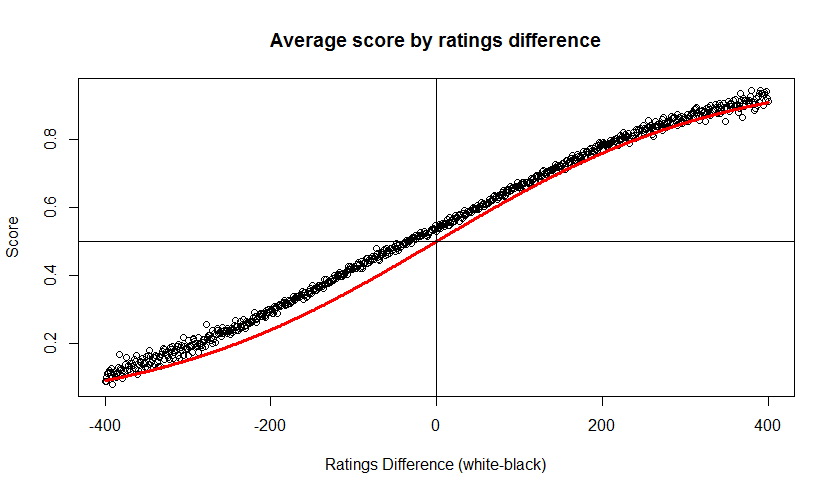
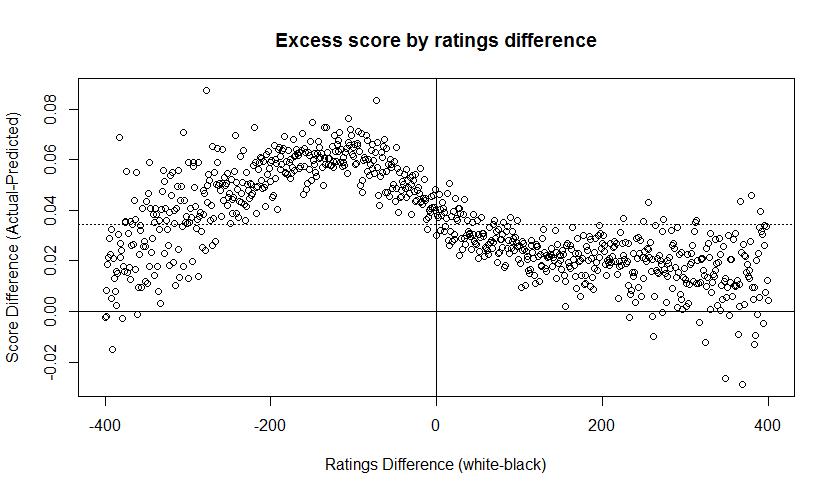
The trend is a bit clearer of we look at the “excess score”, the amount by which white’s results exceed the expected results. In the following chart the average excess score is indicated by a dotted line at y=0.034. So the average performance advantage for white, accounting for the strength of opposition, was around 3.4%. But note how the advantage is strongest where white is playing a slightly stronger player.
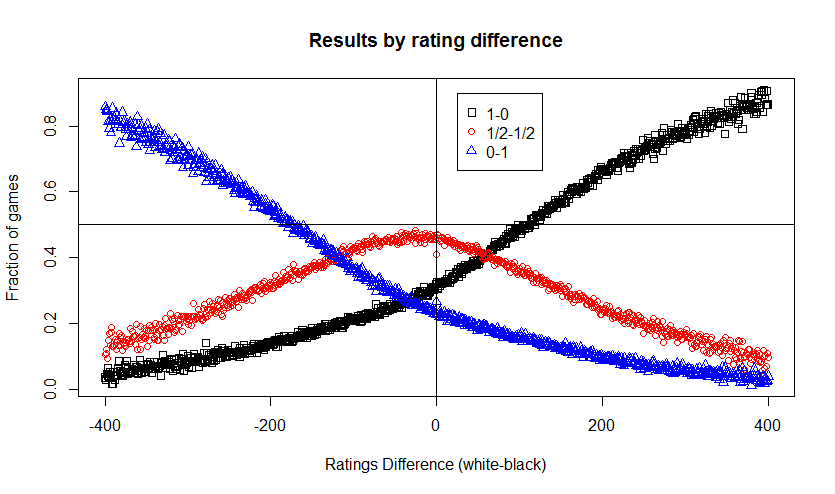
Finally I looked at the actual game results, the distribution of wins, draws and losses, by ratings differences. The Elo formula doesn’t speak to this. It deals with expected scores. But in the real world one cannot score 0.8 in a game. There are only three options: win, draw or lose. In this chart you see the first mover advantage in another way. The entire range of outcomes is essentially shifted over to the left by 35 points.
Once the difference in ELO rating is over a certain level, the advantage of the player with the highest rating is not always only a matter of skills: the nerves of the weaker player can also become a factor. At a simul that Magnus Carlsen recently gave in Las Vegas, all players were wearing a wristband that measured their heartbeat, which was then displayed on a big screen. The heartbeat of some players was higher than 100 bpm, which is probably not so good for you concentration. See the video at http://www.vgtv.no/#!/video/76418/her-knuser-carlsen-20-spillere starting at 2:40.
I admit that this is not strictly related to the first move advantage (except that the player who gives the simul usually has white).
This is an interesting point. There is an intimidation factor certainly, when playing a much higher rated opponent. But I wonder if there is also a motivation factor associated with playing against someone slightly better? You know that if you make that special extra effort you might win? That might explain why I’m seeing the best advantage playing an opponent rated 100 points higher.
I have a large collection (around 650K games) from computer chess tournaments. Those will be free of any psychological effects. I’ll check to what trends are common to that database.
Fascinating!
An alternative way to look at this and confirm what appears to be the significance of having white is to examine the data in a regression analysis. To handle draws consistently, always look at it from the perspective of the player having the white pieces. Then you’ve got the difference in ratings and the outcome (+1, 0, or -1, say).
Here you get to see how much the predicted outcome for equal ratings is greater than zero, and also what the statistical confidence is for that value. Another way of looking at the effect you’ve teased out.
The 4th chart shows the residuals if you modeled the performance as equaling the predicted Elo score. So it is essentially based on a trivial linear model, y=x. Given the distribution of the residuals it looks like no linear model is going to help there.
Great article, Rob!
It would be useful to include another view of your dataset: does the first-move advantage change with level of play? If the average advantage is 35 points, what is it for players rated (for example) 2000, 2400, 2800? You could focus your investigation to roughly evenly matched players to come to some conclusion on this.
do you think that for chess player rated under 1600,1700,1800 white advantage doesn’t exist or it is not used by player,if not why some player score better with black
I have been reading a lot of articles and comments on this topic. To me it seems to be a question about human brain’s (or machine’s) capability to handle 8 x 8 squares in order for white to maintain that advantage or achieve equality or even advantage for black. With this in mind I tend to believe that white’s advantage is more if the size of the board is say 5 x 5 (of course with some pieces removed from the board). The simple reason for my belief is that the game becomes a lot easier with smaller sized board. On the other side, if the board is large say 12 x 12, with some additional pieces and pawns, the game would be lot more difficult for white to even perceive that he has that advantage, because there would be many more possibilities for the moves at every stage of the game. To digress a little, i came across some chess variants that eliminate this supposed advantage. Google for Synchronous chess, parity chess and synchronistic chess to know the rules of these variants.