• Skip to primary navigation
  • Skip to main content
  • Skip to primary sidebar

An Antic Disposition

  • Home
  • About
  • Archives
  • Writings
  • Links
You are here: Home / Archives for R

R

Analysis of World Chess Champion Opening Repertoires

2015/02/25 By Rob 6 Comments

A quick test run of the FactoMineR package for R.   This package focuses on multivariate exploratory data analysis, such as Principle Components Analysis (for numerical data) and Correspondence Analysis (for categorical data).

In an earlier blog post I took a look at a large collection of chess games and tried to quantify the “first move” advantage in chess, in terms of ratings.   This time I’ll use the same large database of chess games, and look at opening repertoires.  A chess opening is a set of moves that a player uses at the start of the game in an attempt to steer the game to positions familiar to the player, and which align with that player’s style and preferences.  Such openings have descriptive, often colorful names, like King’s Gambit, Sicilian Poisoned Pawn, or Nimzo-Indian Defense, as well as a standard code, from the Encyclopedia of Chess Openings, like B07, C44 and E80.   There are 500 such “ECO” codes, from A00 to E99.

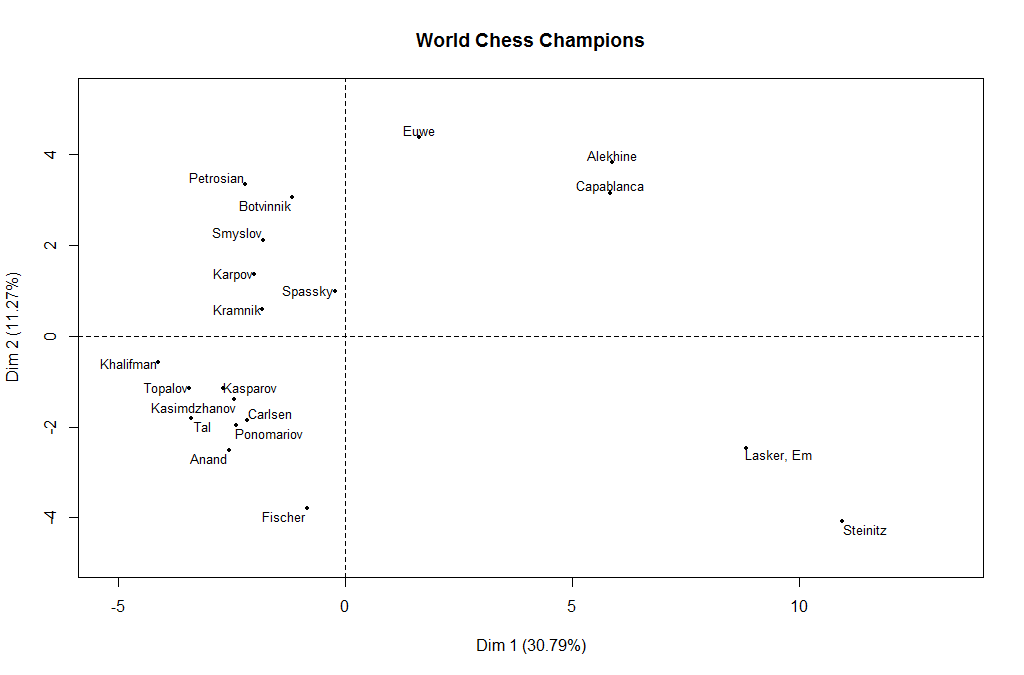
I extracted games from all World Chess Champions, from Steinitz (1866) to Carlsen (2014) and calculated the percentage of the games for each player in each ECO code.   So each player’s opening repertoire is represented as a vector of 500 weights, summing to 1.0.   I then used FactoMineR’s PCA() method to extract principle components from this dataset.     The first two components extracted together represent around 42% of the total variance.

Plotting the Champions against these two dimensions shows some intriguing patterns, bringing together players by era:

wch

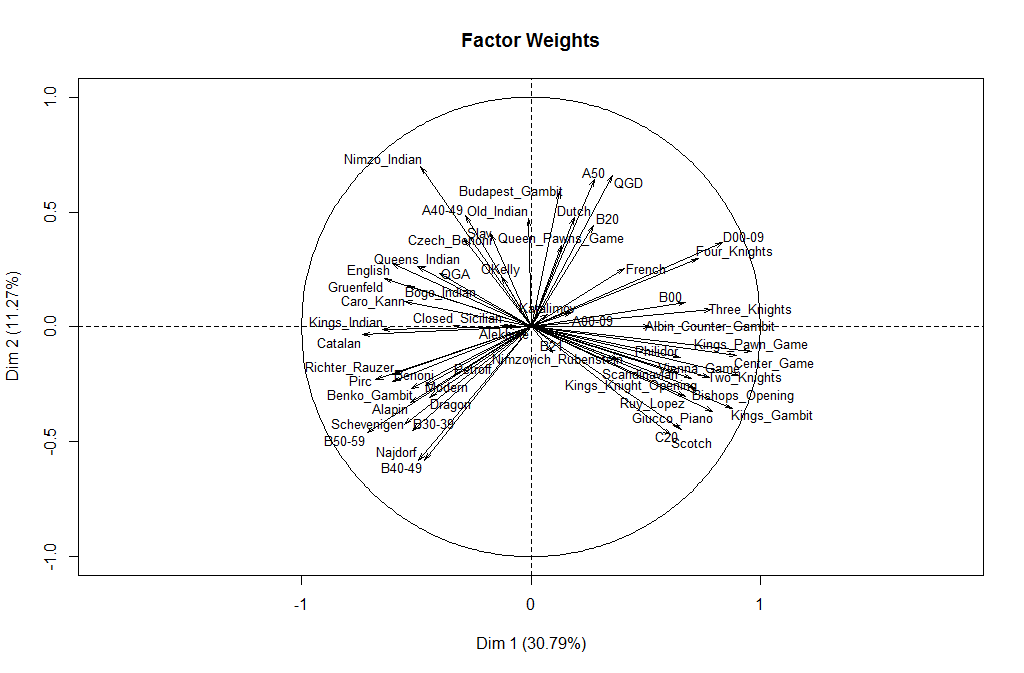
Further insights can be gleaned by plotting how these two components weight the various openings.   To make it easier to read I grouped some of the ECO codes and used descriptive names for the better-known openings.   From this we see that the first component appears to distinguish the player’s use of open games (1.e4 e5) in the positive direction versus semi-open and closed games in the  negative direction.   I’m having a harder time reading a real-world meaning into the second component.  Maybe a reader sees something here?

weights

Something to remember in all of this is that the choice of opening in a game is a result of the moves of both players.    Players try to influence the opening, steer the game toward their advantages and preparations and against those of their opponents.   But neither player has 100% control over the opening, aside with some fringe moves like 1. h4.   However,  players, especially world-class caliber players, do specialize in certain opening systems, and it is fair to speak of their repertoires.


Update:

The comment from Dana Mackenzie prompted me to try out another feature of FactoMineR, the ability to chart supplemental variables.  These are variables that are not used in doing the underlying PCA calculation but can be shown in the charts, to see how they align with the extracted components.  For example, I could add catagorical variable for each player to represent their nationality and then plot that, to see if there are national schools of practice regarding openings.  Or, as I’ll do here, add a year variable the year the individual won their world championship, to see how this aligns:
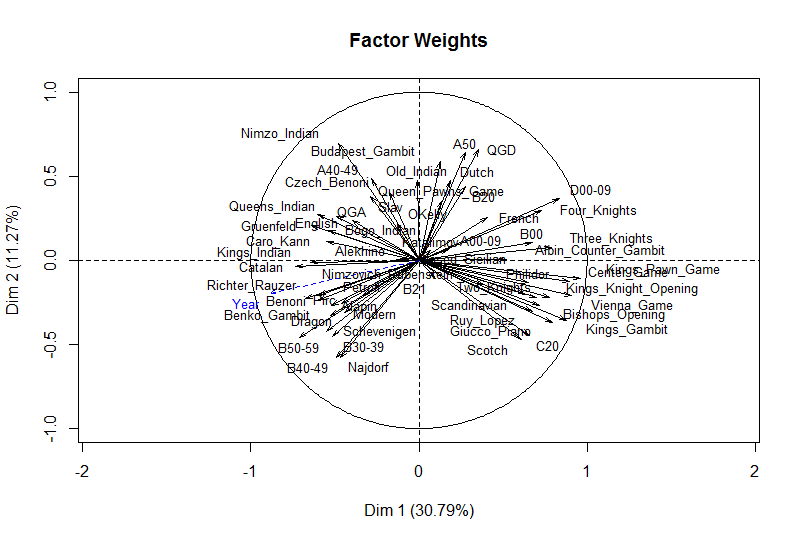
wch-yearWe can see by the length of the line here that the Year has a strong correlation with these two components, mostly with the 1st component.
 

  • Tweet

Filed Under: Chess, R

The Words Democrats and Republicans Use

2014/02/07 By Rob Leave a Comment

It came to me after listening to the State of the Union Address:   Can we tell whether a speech was from a Democrat or a Republican President, purely based on metrics related to the words used?  It makes sense that we could.  After all, we can analyze emails and detect spam that way.  Automatic text classification is a well known problem.   On the other hand, presidential speeches go back quite a bit.  Is there a commonality of speeches of, a Democrat in 2014 with one from 1950?  Only one way to find out…

I decided to limit myself to State of the Union (SOTU) addresses, since they are readily available, and only those post WW II.  There has been a significant shift in American politics since WW II so it made sense, for continuity, to look at Truman and later.   If I had included all of Roosevelt’s twelve (!) SOTU speeches it might have distorted the results, giving undue weight to individual stylistic factors.   So I grabbed the 71 post WWII addresses and stuck them into a directory.  I included only the annual addresses, not any exceptional ones, like G.W. Bush’s special SOTU in September 2001.

I then used R’s text mining package, tm, to load the files into a corpus, tokenize, remove punctuation, stop words, etc.  I then created a document-term matrix and removed any terms that occurred in fewer than half of the speeches.  This left me with counts of 610 terms in 71 documents.

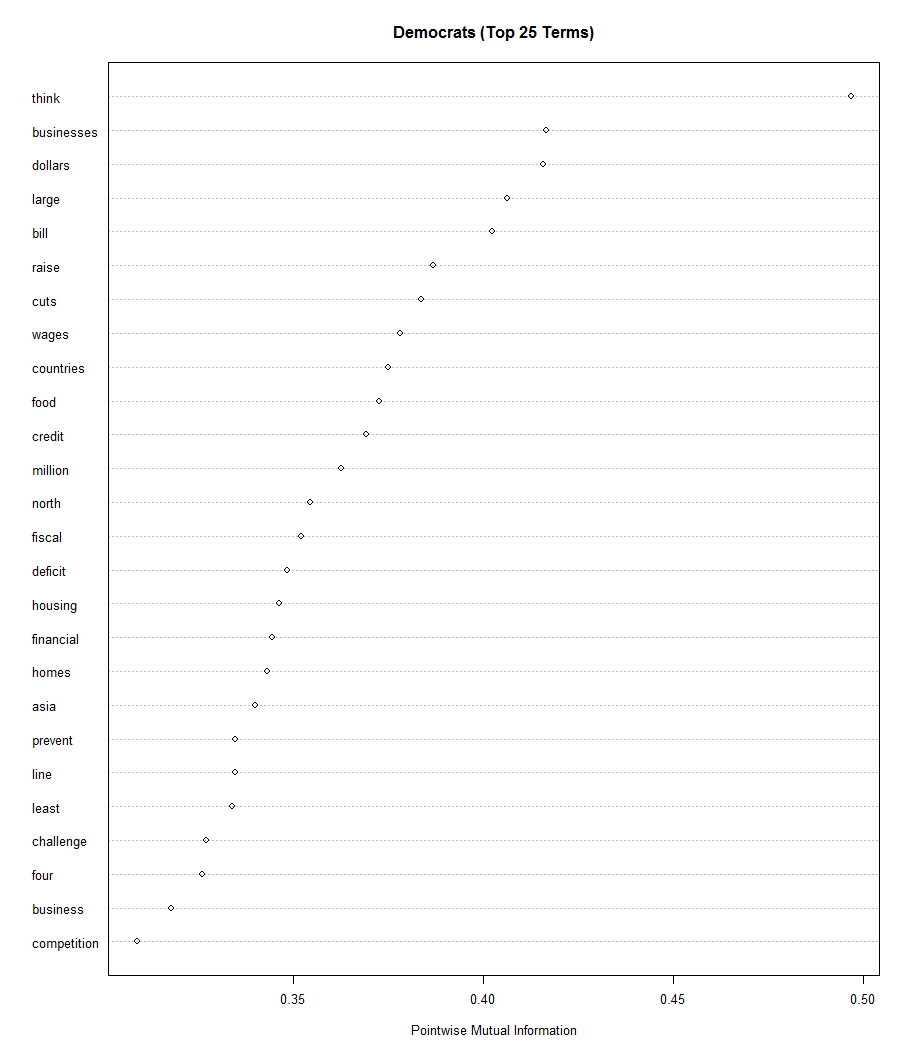
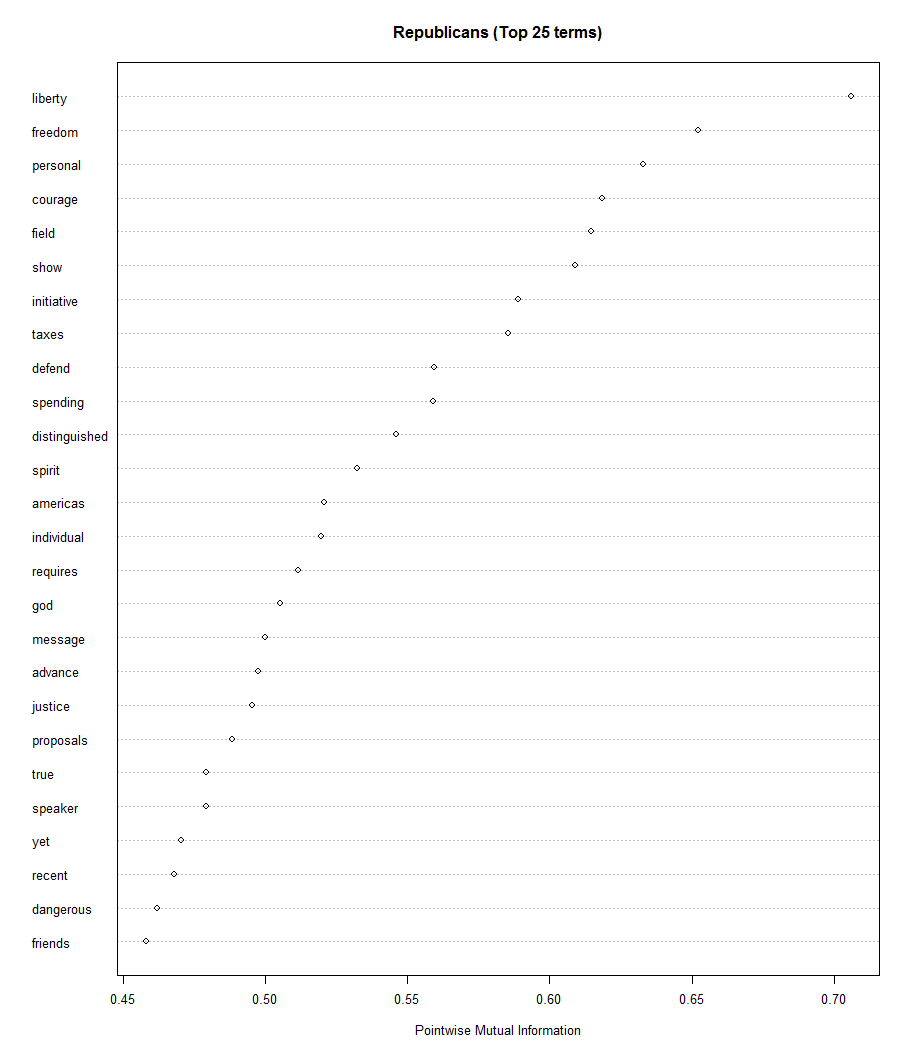
Then came the fun part.  I decided to use Pointwise Mutual Information (PMI),  an information-centric measure of association from information retrieval, to look at the association between terms in the speeches and party affiliation.  PMI shows the degree of association (or “co-location”) of two terms while also accounting for their prevalence of the terms individually.  Wikipedia gives the formula, which is pretty much what you would expect.   Calculate the log probability of the co-location and subtract out the log probability of the background rate of the term.  But instead of looking at the co-occurrence of two terms, I tried looking at the co-occurrence of terms with the party affiliation.    For example, the PMI of “taxes” with the class Democrat would be:  log p(“taxes”|Democrat) – log p(“taxes”).  You can see my full script for the gory details.

Here’s what I got, listing the 25 highest PMI terms for Democrats and Republicans:

So what does this all mean?  First note the difference in scale.  The top Republican terms had higher PMI than the top Democrat terms.  In some sense it is a political Rorschach test.  You’ll see what you want to see.  But in fairness to both parties I think this does accurately reflect their traditional priorities.

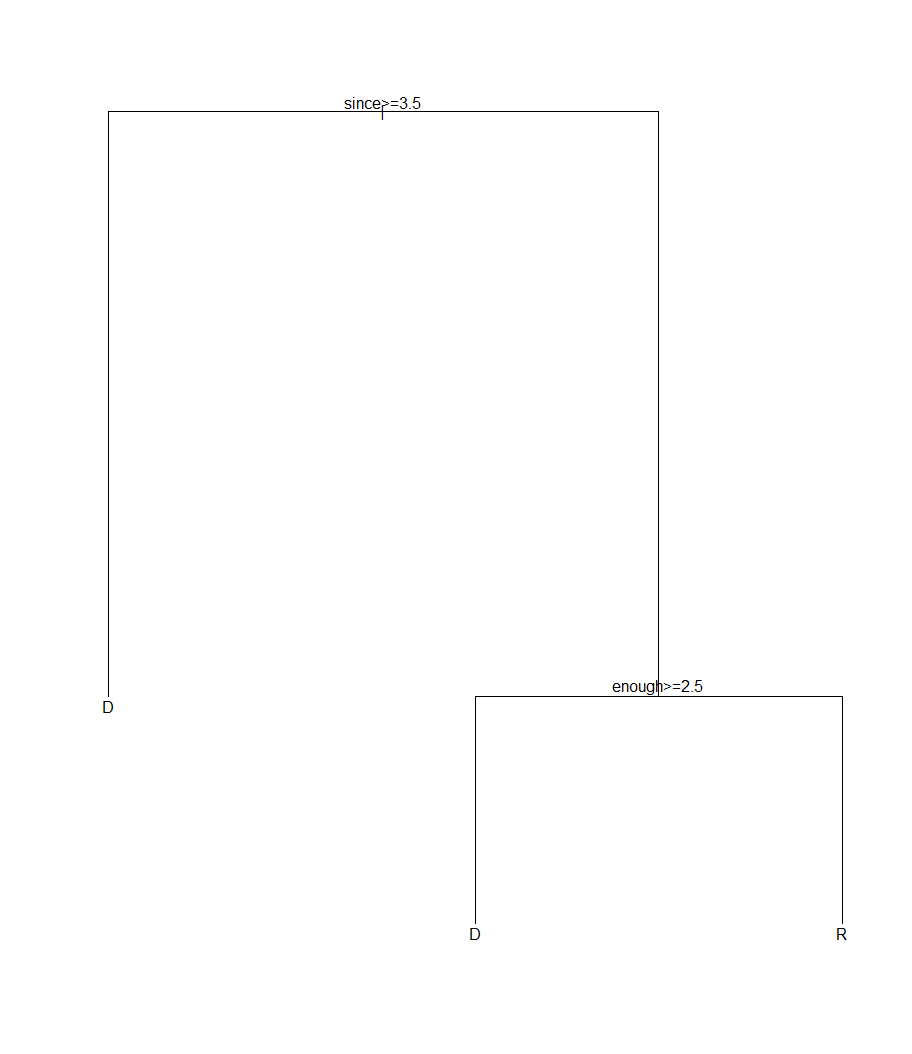
From the analytic standpoint the interesting thing I notice is how this compares to other approaches, like using classification trees.  For example, if I train the original data with a recursive partitioning classification tree, using rpart, I can classify the speeches with 86% accuracy by looking at the occurrences of only two terms:

Not a lot of insight there. It essentially latched on to background noise and two semantically useless words.   So I prefer the PMI-based results since they appear to have more semantic weight.

Next steps: I’d like to apply this approach back to speeches from 1860 through 1945.

  • Tweet

Filed Under: Language, R

First Move Advantage in Chess

2014/01/27 By Rob 8 Comments

The Elo Rating System

Competitive chess players, at the amateur club level all the way through the top grandmasters, receive ratings based on their performance in games.   The ratings formula in use since 1960 is based on a model first proposed by the Hungarian-American physicist Arpad Elo.  It uses a logistic equation to estimate the probability of a player winning as a function of that player’s rating advantage over his opponent:

E = \frac 1 {1 + 10^{-\Delta R/400}}

So for example, if you play an opponent who out-rates you by 200 points then your chances of winning are only 24%.

After each tournament, game results are fed back to a national or international rating agency and the ratings adjusted.  If you scored better than expected against the level of opposition played your rating goes up.  If you did worse it goes down.  Winning against an opponent much weaker than you will lift your rating little.  Defeating a higher-rated opponent will raise your rating more.

That’s the basics of the Elo rating system, in its pure form.  In practice it is slightly modified, with ratings floors, bootstrapping new unrated  players, etc.  But that is its essence.

Measuring the First Mover Advantage

It has long been known that the player that moves first, conventionally called “white”, has a slight advantage, due to their ability to develop their pieces faster and their greater ability to coax the opening phase of the game toward a system that they prefer.

So how can we show this advantage using a lot of data?

I started with a Chessbase database of  1,687,282 chess games, played from 2000-2013.   All games had a minimum rating of 2000 (a good club player).  I excluded all computer games.   I also excluded 0 or 1 move games, which usually indicate a default (a player not showing up for an assigned game) or a bye.  I exported the games to PGN format and extracted the metadata for each game to a CSV file via a python script.  Additional processing was then done in R.

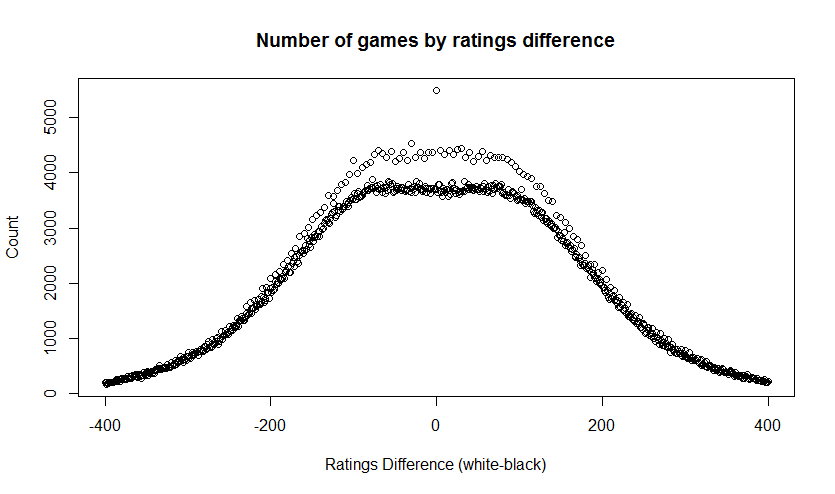
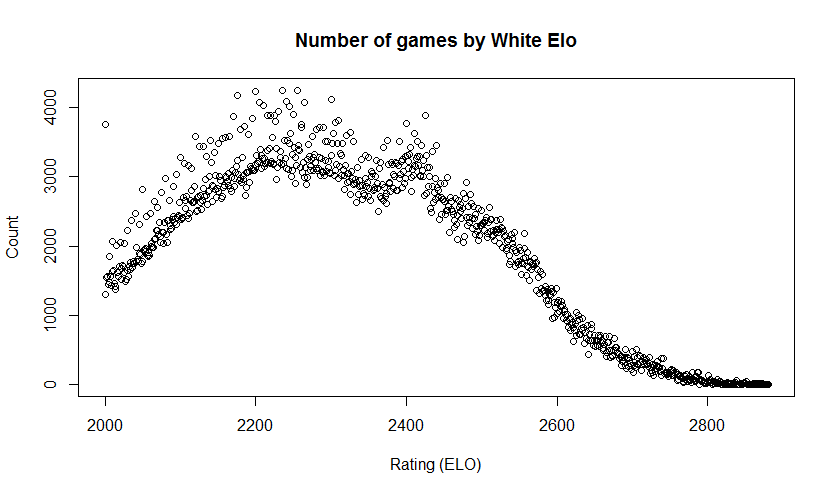
Looking at the distribution of ratings differences (white Elo-black Elo) we get this.  Two oddities to note.  First note the excess of games with a ratings difference of exactly zero.  I’m not sure what caused that, but since only 0.3% of games had this property, I ignored it.   Also there is clearly a “fringe” of excess counts for ratings that are exactly multiples of 5.  This suggests some quantization effect in some of the ratings, but should not harm the following analysis.


The collection has results of:

  • 1-0 (36.4%)
  • 1/2-1/2 (35.5%)
  • 0-1 (28.1%)

So the overall score, from white’s perspective was 54.2% (counting a win as 1 point and a draw as 0.5 points).

So white as a 4.2% first move advantage, yes?  Not so fast.   A look at the average ratings in the games shows:

  • mean white Elo: 2312
  • mean black Elo: 2309

So on average white was slightly higher rated than black in these games.  A t-test indicated that the difference in means was significant to the 95% confidence level.  So we’ll need to do some more work to tease out the actual advantage for white.

Looking for a Performance Advantage

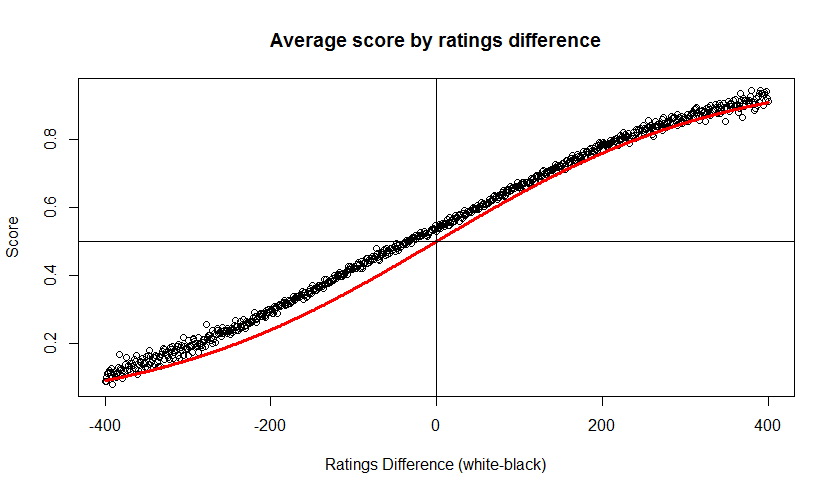
I took the data and binned it by ratings difference, from -400 to 400, and for each difference I calculated the expected score, per the Elo formula, and the average actual score in games played with that ratings difference.   The following chart shows the black circles for the actual scores and a red line for the predicted score.  Again, this is from white’s perspective.   Clearly the actual score is above the expected score for most of the range.   In fact white appears evenly matched even when playing against an opponent 35-points higher.

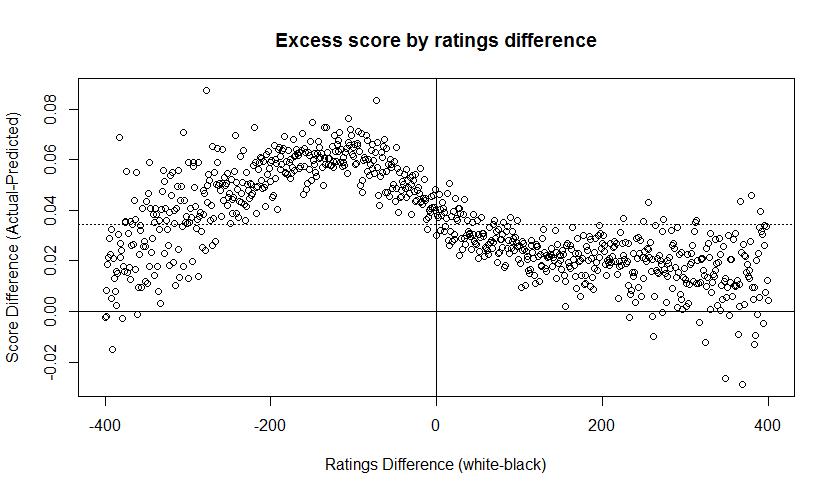
The trend is a bit clearer of we look at the “excess score”, the amount by which white’s results exceed the expected results.  In the following chart the average excess score is indicated by a dotted line at y=0.034.  So the average performance advantage for white, accounting for the strength of opposition, was around 3.4%.  But note how the advantage is strongest where white is playing a slightly stronger player.

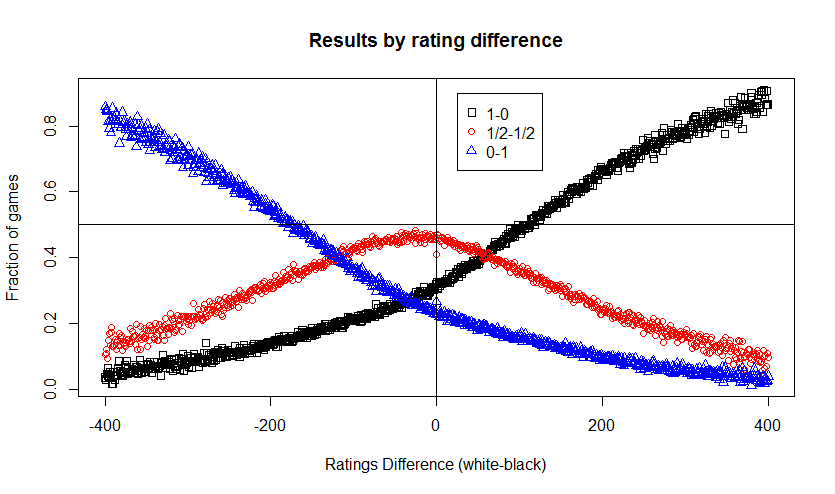
Finally I looked at the actual game results, the distribution of wins, draws and losses, by ratings differences.  The Elo formula doesn’t speak to this.  It deals with expected scores.  But in the real world one cannot score 0.8 in a game.   There are only three options:  win, draw or lose.  In this chart you see the first mover advantage in another way.  The entire range of outcomes is essentially shifted over to the left by 35 points.

  • Tweet

Filed Under: Chess, R Tagged With: Chess

Primary Sidebar

Copyright © 2006-2023 Rob Weir · Site Policies


Loading Comments...