A quick test run of the FactoMineR package for R. This package focuses on multivariate exploratory data analysis, such as Principle Components Analysis (for numerical data) and Correspondence Analysis (for categorical data).
In an earlier blog post I took a look at a large collection of chess games and tried to quantify the “first move” advantage in chess, in terms of ratings. This time I’ll use the same large database of chess games, and look at opening repertoires. A chess opening is a set of moves that a player uses at the start of the game in an attempt to steer the game to positions familiar to the player, and which align with that player’s style and preferences. Such openings have descriptive, often colorful names, like King’s Gambit, Sicilian Poisoned Pawn, or Nimzo-Indian Defense, as well as a standard code, from the Encyclopedia of Chess Openings, like B07, C44 and E80. There are 500 such “ECO” codes, from A00 to E99.
I extracted games from all World Chess Champions, from Steinitz (1866) to Carlsen (2014) and calculated the percentage of the games for each player in each ECO code. So each player’s opening repertoire is represented as a vector of 500 weights, summing to 1.0. I then used FactoMineR’s PCA() method to extract principle components from this dataset. The first two components extracted together represent around 42% of the total variance.
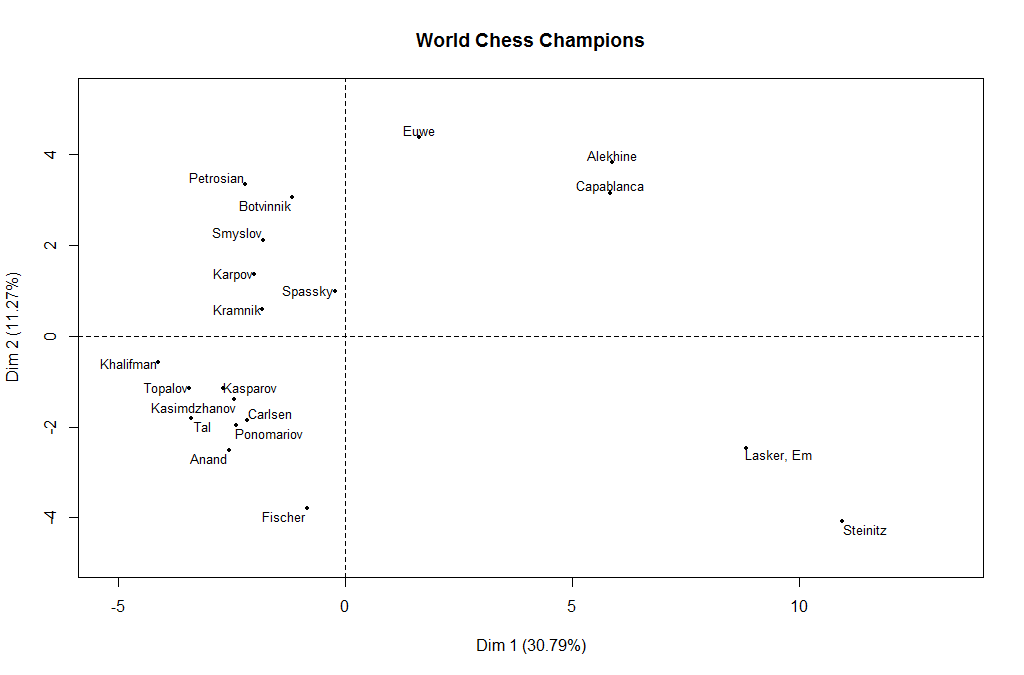
Plotting the Champions against these two dimensions shows some intriguing patterns, bringing together players by era:
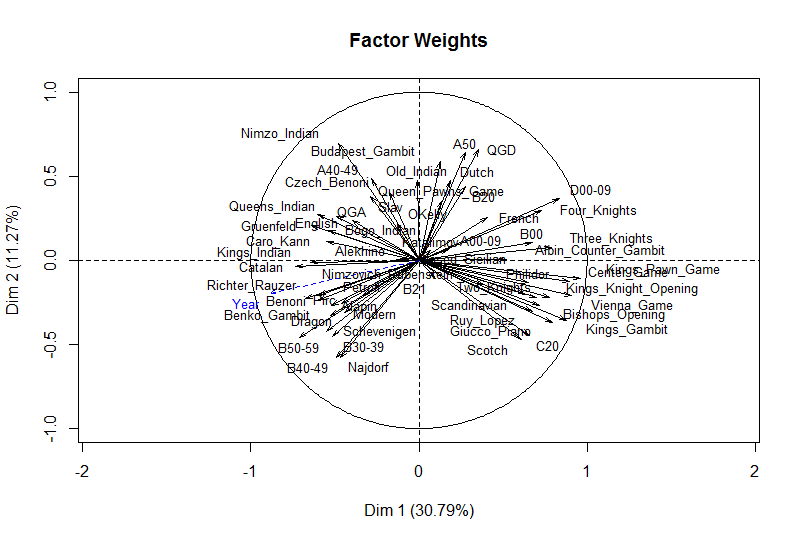
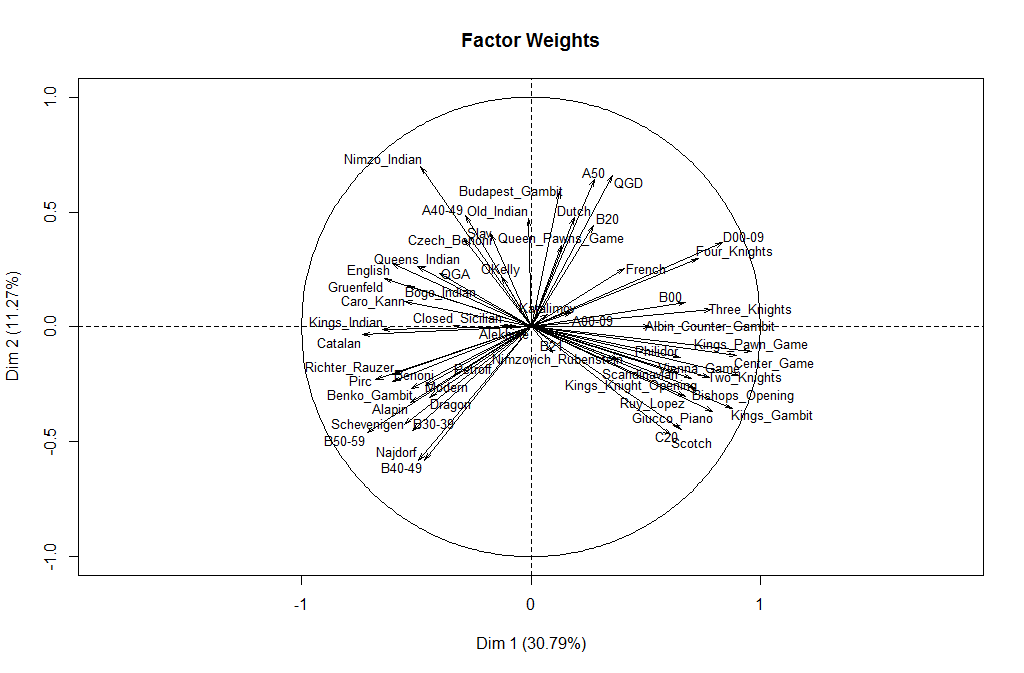
Further insights can be gleaned by plotting how these two components weight the various openings. To make it easier to read I grouped some of the ECO codes and used descriptive names for the better-known openings. From this we see that the first component appears to distinguish the player’s use of open games (1.e4 e5) in the positive direction versus semi-open and closed games in the negative direction. I’m having a harder time reading a real-world meaning into the second component. Maybe a reader sees something here?
Something to remember in all of this is that the choice of opening in a game is a result of the moves of both players. Players try to influence the opening, steer the game toward their advantages and preparations and against those of their opponents. But neither player has 100% control over the opening, aside with some fringe moves like 1. h4. However, players, especially world-class caliber players, do specialize in certain opening systems, and it is fair to speak of their repertoires.
Update:
The comment from Dana Mackenzie prompted me to try out another feature of FactoMineR, the ability to chart supplemental variables. These are variables that are not used in doing the underlying PCA calculation but can be shown in the charts, to see how they align with the extracted components. For example, I could add catagorical variable for each player to represent their nationality and then plot that, to see if there are national schools of practice regarding openings. Or, as I’ll do here, add a year variable the year the individual won their world championship, to see how this aligns:
 We can see by the length of the line here that the Year has a strong correlation with these two components, mostly with the 1st component.


That’s a really weird distribution in the second plot, isn’t it? There is a whole quadrant that doesn’t seem to be represented by any opening. The simplest hypothesis would have been that the first principal component corresponds to White’s first move and the second principal component corresponds to Black’s first move. There’s a rough sense in which this is true, with … d5 and … f5 being at the top, … c5 at the bottom, and … e5 and … Nf6 kind of in between. But there are too many exceptions for it to be a clear rule.
Fischer is an interesting case, as the only world champion who lies in the “forbidden zone.” I think this reflects his strong attachment to two openings: 1. e4 as White (he *almost* never played anything else) and the Sicilian as Black. So his vector is quite similar to an average of (10, 0) and (-8, -6).
The historical trend is really quite astounding, with an almost monotonic counterclockwise rotation from the earliest champions (Steinitz, Lasker) to the most recent ones (Anand, Carlsen) with only Fischer as an outlier. Bizarre as it seems, your data is best described by the coordinates x = open/closed opening, theta = year.
Would it be easy for you to take a large database, like the one in your previous post, and tabulate the number of games and winning percentage for White in each of the 50 ECO codes (A0, A1, …, E9) or even in each of the 500 ECO codes (A00, A01, …, E98, E99)? That would be very interesting for me to see. I have a very recent blog post that is relevant to this question. (http://www.danamackenzie.com/blog/?p=3440)
Hi Dana,
It would not be characteristic of this technique to have components that had a polar coordinate length/theta type relationship. But I believe you are correct that date is involved. I added another plot, which you can see above now, that shows how a new “year” variable, representing the year the person one their first world championship, aligns with the two components. You can see here that this is strongly aligned with the first component, with time increasing in the -X direction. That would explain the most recent champions being on the left, and the oldest ones being on the right.
It would be interesting to look only at games played in a shorter period of time, say all high category tournaments played since 2000, to see what the components are like once you take century-long style evolutionary changes out of the equation.
I do have data on player performance by ECO code. I’ll send that along.
Interesting stuff! Any chance you’d be willing to share how you extracted the ECO codes (or if it all ran in R)? I don’t know of any good way in ChessBase to get that output, maybe by saving to a text file and then reg-exing out all the non ECO/name info.
I filtered in Chessbase and then copied/pasted the desired games into a new PGN-format database. Then I wrote a simple Python script to parse the PGN headers to extract and tally the opening and rating data, writing out a CSV file of the results. This I then loaded into R via read.csv(). It should be possible to parse the PGN directly in R. This would be a near R package to have. I looked around and the nearest I found was this start: http://www.r-bloggers.com/first-attempt-at-chess-data-mining/
I do have C++ code for parsing the older Chessbase CBF format, and used that for several utilities. But I have not come across any sufficient format documentation for their newer CBH format.
Thanks for sending the data on the ECO codes! It’s fascinating and will provide me material for at least one, and maybe several blog posts.
As a mathematician, I am aware that PCA is not supposed to identify nonlinear factors, such as the polar coordinate in your graphs. But what fascinates me is that the data seem to want to have this structure. By “flattening” the data out to a linear trend, I think that you miss the way that Capablanca and Alekhine and Botvinnik were different from contemporary chess players. (Their openings had a strong component in the second direction.) You also miss the possibility I mentioned in my blog post (still highly conjectural) that we are actually moving around a circle and back towards Fischer. Finally, of course, you miss the whole Fischer outlier! Fischer is fairly similar to Botvinnik on the first component, but very different on the second.
So I’m sticking to my story that the first and second coordinates form a pair in which x and theta (not y!) contain the most relevant domain-specific information. I would be willing to bet that such a phenomenon has not been reported before in the literature of principal component analysis.