• Skip to primary navigation
  • Skip to main content
  • Skip to primary sidebar

An Antic Disposition

  • Home
  • About
  • Archives
  • Writings
  • Links
You are here: Home / Archives for Blogging/Social

Blogging/Social

Twitter Powers of Ten

2011/03/25 By Rob 19 Comments

Time-Based Profiling

Before any of this will make sense, I ask you to imagine doing a survey of your local shopping mall or other busy commercial shopping district.  You want to know where people congregate, where they spend most of their time.  Is it in a particular shop, in the food court, or in some dark corner of the parking garage?

There are a few ways of solving this problem:

  • You could have a video capture of the entire complex, digitize that data and map where everyone is.  Aggregate over a representative time interval (days?  weeks?) and you will have a good idea where people hang out.  The downside of this approach is that it requires an expensive and complex camera system,  and generates a massive amount of data.
  • Another approach would be to do this with a series of still cameras that cover the entire mall.  Take a snapshot at period intervals.  A bit less expensive, but still requires “getting everyone in the frame”.
  • Yet another approach is to sample both by time and by location.  So don’t install cameras all over the mall.  Have one hand-held camera, and take a picture in the book store one minute, another picture in the food court another minute, etc.  Aim for coverage over time and locations.  And repeat, repeat, repeat.  Take thousands of samples.  This is low tech on the data capture side, but can still generate massive amounts of data.

So three approaches.  Obviously some approaches are easier to implement for the owner of the mall.  But only the last one is doable by the average citizen.

This is essentially the situation we find ourselves in with Twitter.  They do have APIs that can be used to query their user data.  But it is all “rate-limited”, meaning only a certain number of requests can be made per IP address per day.  So it is impossible to get a running stream of all activity (a “video”) or even a snapshot of all activity at a single time (a “still camera”).  But what we can do is access the “Twitter Public Timeline“, which will give you the most recent 20 tweets.  This can be queried every 60 seconds, up to your daily limit.

I’ve been capturing the Twitter Public Timeline since late 2009.  I have now nearly 6 million records, each one containing the message, of course, but also the name of the user and their “Followers” and “Following” count at that point in time.  I started doing scatter plots of this data and was amazed at the detailed structure evident in the data, that illustrate some interesting ways in which Twitter is being used.  No single graph can show it all, so I’m giving you a series of charts, each one showing an area of the Following/Followers phase space 10x larger.

All charts here were done using the open source R environment.

One Thousand Followers

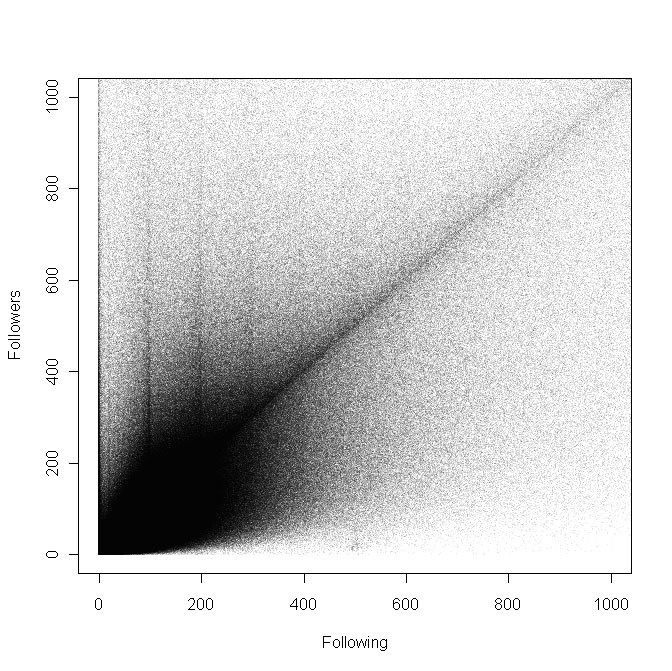
In this chart each pixel represents one Twitter user, plotted at a position reflecting how many people they are Following, and how many Followers they in turn have.  This chart is zoomed in to show only those whose Following/Follower counts are 1000 or fewer.

We see a few trends here.  First, there is a predominance of users with counts less than 300 or so.  But we also see a strong trend toward parity in counts.  That is the line going up to the right at 45 degrees.  This would be expected for socially-interacting groups of mutual followers.

What I did not expect were the “spikes” for users who follow 100, 200 and 300 accounts.  This is not an aliasing artifact of the graphing.  This is real.  Is there something out there that would lead large numbers of users to follow exactly 100, 200 or 300 users?

(For those of you interested in how the chart was created, I used alpha blending to deal with the “overplotting” problem.  So each point is plotted in a partially transparent way, so an area gets darker the greater the density of points.  If I didn’t do that, the entire chart would be one giant blot of black, with no discernible patterns.   I also introduced random “jitter” between -0.5 and 0.5 to avoid false patterns caused by integer quantization interacting with screen resolution.)
Ten Thousand Followers

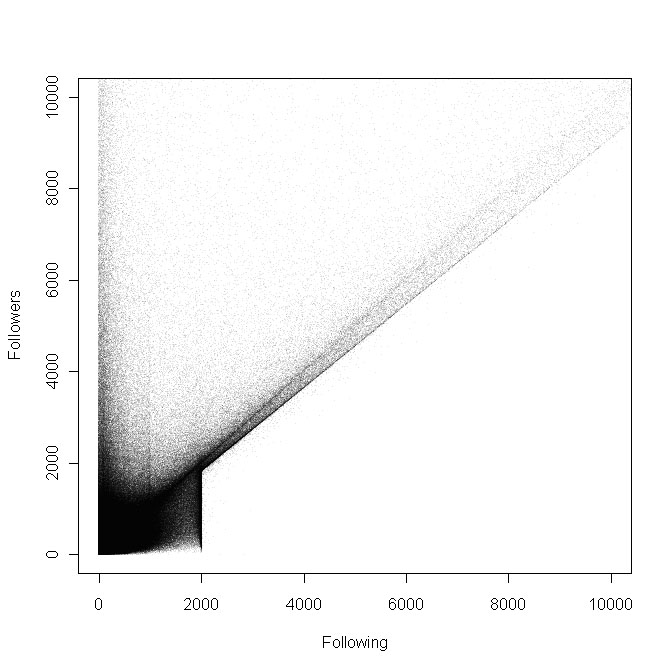
Moving out a factor of ten, we now look at those users who have 10,000 or fewer followers.  Again, each pixel represents one sampled user.  The entire previous chart would fit in to the lower left corner.

The salient feature here is the hard cut-off at 2000.  This is due to Twitter’s “aggressive following” limitation:  “Once you’ve followed 2000 users, there are limits to the number of additional users you can follow: this limit is different for every user and is based on your ratio of followers to following.”  They are a bit coy about what exactly the rule is, but a look at the chart certainly suggests that having a Following/Followers ratio > 1 is going to be a problem.

We also see an unexplained density of people Following exactly 1000 users.
One Hundred Thousand Followers

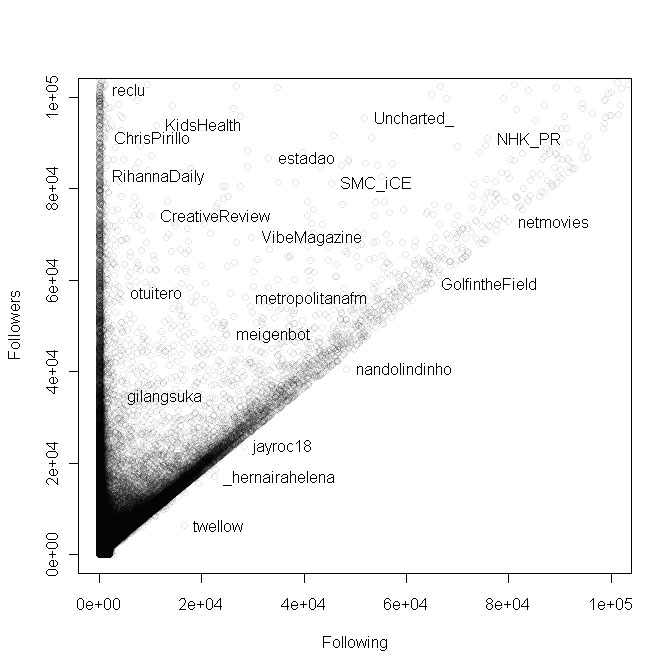
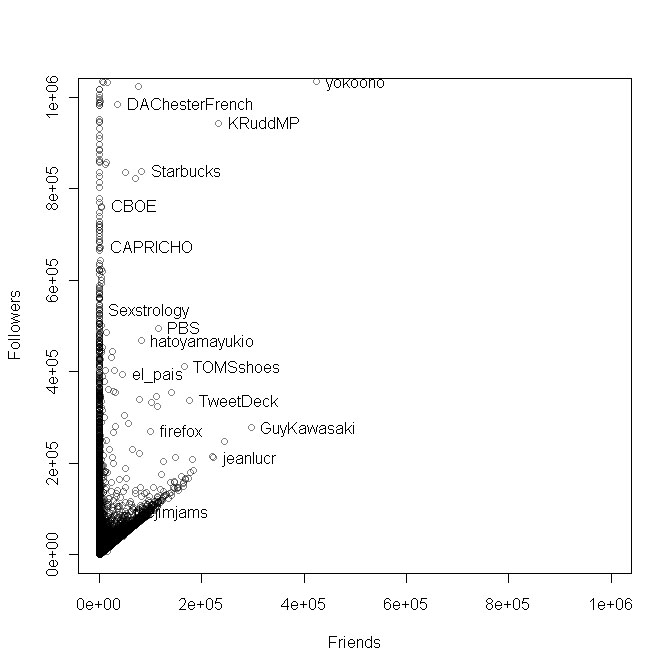
Another factor of 10 and we switch to a different presentation, representing users with small circles rather than pixels.  We’re now starting to see recognizable users and information sources.  I’m illustrating some account names at random.   Maybe not exactly celebrities, but there are some broadly followed users here.  Since the only way to follow 100,000 users is to have close to that number already following you, the lower right half of the chart is empty, and will remain so as we continue to zoom out.

The structure here seems to be:

  • Information pushers who follow nearly no one, up the y-axis on the left.
  • Users who follow almost everyone who follows them, running diagonally
  • Nothing much in the middle

One Million Followers

Zooming out another factor of 10, and we see that the Following count trails off.  Does Twitter have another limit here?  Or do people realize that it is pointless to follow 500,000 people?  But why wouldn’t they also see that it is senseless to follow 50,000 people?
Ten Million Followers

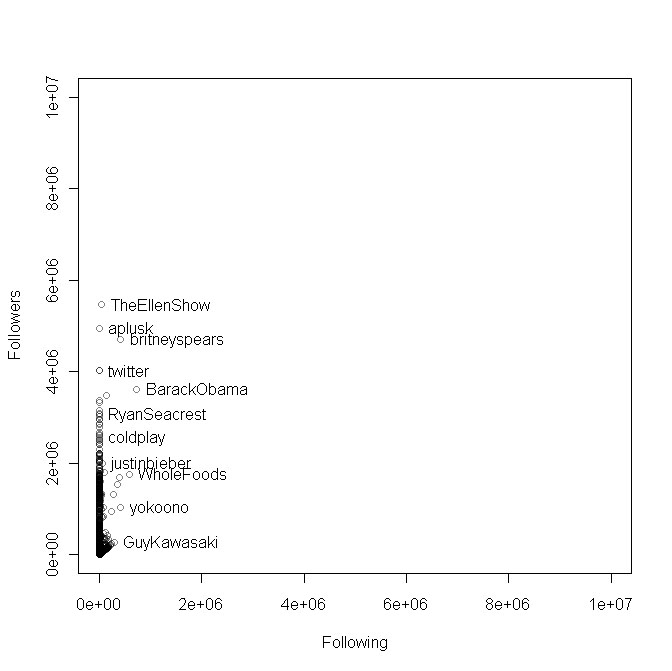
And in the last chart we take it out one more order of magnitude, and the Twitterverse recedes to be Ellen DeGeneres, Britney Spears, Barack Obama, Justin Bieber and Ashton Kutcher.   If you are an average Twitter user, like me, everyone you know and actually interact with on Twitter is represented by 1/20th of a pixel in the lower left corner of the chart.

Note that this chart (and the previous) one does not reflect the current Follower/Following count for these particular users.  This is not a concurrent snapshot.  This was all sampled over an 18 month period of time. Different users are necessarily shown according to their status at different dates.  The point is to show the structure of the data, not make a claim that, e.g., Ellen DeGeneres has more followers than Justin Bieber.
  • Tweet

Filed Under: Blogging/Social

Twitter 2010 by the Numbers

2011/01/02 By Rob 1 Comment

Throughout 2010, I recorded Twitter messages (tweets) from Twitter’s “public timeline“.  I took these snapshots every two minutes, around the clock.  At the end of the year now have 4,973,728 tweets.

The first message, at 12:00:08 EST January 1st, 2010, was: “2009 will be remembered at [sic] the year the music died.  Michael left us a powerful mantra for 2010”.

And the ominous last message was “2011 chegou… 2012 o mondo acaba”  at 11:58:52 EST, December 31st. (2011 has arrived…. in 2012 the end of the world)

I collected the data without any advance thought on what I could do with it.  The general thought was I’d look for something interesting.  Now that 2010 is over, I’ve started some analysis.  I’d to share what I’ve found so far.  More will follow.

It is important to have a proper sense of caution when using this data.  How random is it really?  I don’t know how Twitter produces the “public timeline”.  Certainly it excludes those whose tweets are private.  Also, the time sampled approach, of taking a snapshot of 20 tweets every two minutes, leaves open the possibility of missing short-term phenomena.  For example, if a million users all tweet something on a particular topic at exactly noon on January 4th, and I don’t take a snapshot until 12:04, then I will miss that topic entirely  At the very least it will be under-represented.  But so long as we’re willing to acknowledge that we might be missing interesting behavior that occurs at shorter times scales, we can fairly make some more general observations.

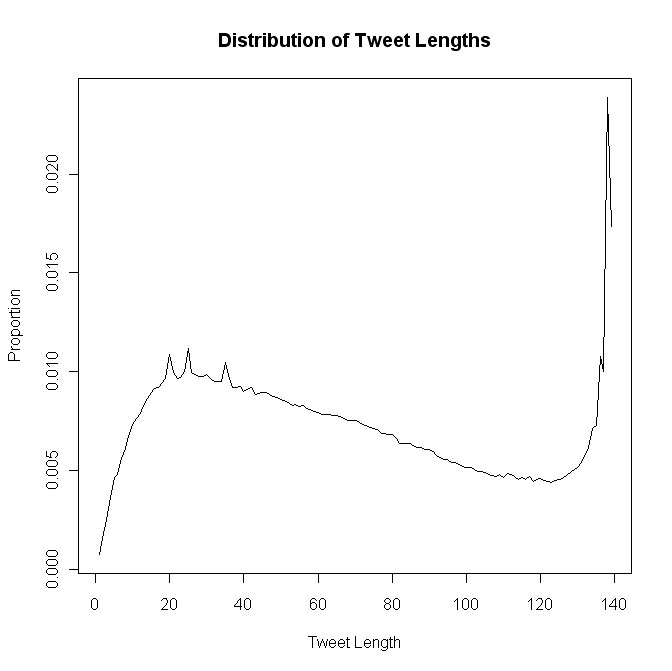
First up I wanted to look at the distribution of tweet lengths.  Are people keeping it short?  Or are they running into the 140-character limit?  The answer, as seen in the following chart, is a clear “Yes” on both counts.    There are two clear peaks, one in the 20-25 character range, and another pushing at the limit, in the 139-140 character length.

So what is going on here?  One explanation could be that the shorter tweets are coming from mobile clients, while longer tweets are coming from web and desktop twitter clients. At first I suspected that the longer tweets might indicate users bumping into the 140 character limit, and this might show itself as truncated content, greater use of abbreviations and general frustration.  But when I took a closer look I saw that most of the maximal length tweets were machine-generated, intentionally targeted to that length,  like:  “New story posted ‘This title is truncated so total tweet is 140 characters long…’ http://bit.ly/foobar”.

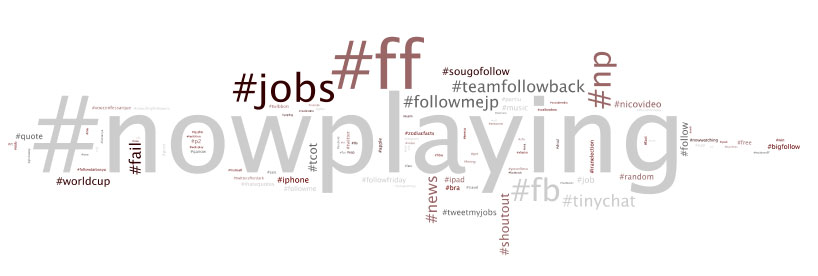
Next, I took a look at hash tags, and tabulated those by frequency.  A word cloud (made in Wordle) of the top 100 tags is:

And here are the top 20 hash tags as a list:

  1. #nowplaying
  2. #ff
  3. #jobs
  4. #np
  5. #fb
  6. #tinychat
  7. #teamfollowback
  8. #followmejp
  9. #news
  10. #fail
  11. #shoutout
  12. #tcot
  13. #worldcup
  14. #sougofollow
  15. #follow
  16. #nicovideo
  17. #job
  18. #tweetmyjobs
  19. #iphone
  20. #quote

Although we might wonder what Twitter’s revenue model is in the long term, it seems that other companies like Facebook and Google are using Twitter to the own advantage.  There were very few hash tags at the top that were actually topical, like #wordcup.  This is clearly at odds with what Twitter reported on their “Top Twitter Trends in 2010” page.  They list #rememberwhen in first place.  It is 925th on my list.  It is odd that Twitter’s official list contains no non-English hash tags as well.  And no competing social sites, like Facebook.  Obviously they are using a different methodology in putting together their numbers.

Next I looked at the top Twitter accounts targeted in a tweet:

Justin Bieber is the clear winner here.  The top 20 were:

  1. @justinbieber
  2. @addthis
  3. @youtube
  4. @foursquare
  5. @nickjonas
  6. @joejonas
  7. @ihatequotes
  8. @soalcinta
  9. @luansantanaevc
  10. @ladygaga
  11. @detikcom
  12. @ddlovato
  13. @revrunwisdom
  14. @soalbowbow
  15. @zodiacfacts
  16. @thelovestories
  17. @adriesubono
  18. @dff_clickbokin
  19. @eduardosurita
  20. @nickiminaj

Next I looked at the content of the tweets, to find what 5-word strings were the most common.  The top 20 phrases are:

  1. just joined a video chat
  2. i favorited a youtube video
  3. i liked a youtube video
  4. i uploaded a youtube video
  5. check this video out —
  6. photos on facebook in the
  7. you need to check out
  8. add a #twibbon to your
  9. i just became the mayor
  10. if you want more followers
  11. way of getting 100 free
  12. for a chance to win
  13. get 100 free more twitter
  14. in a live video chat
  15. just snapped a new picture
  16. click the link to join
  17. a live video chat with
  18. want more followers check out
  19. you should check out this
  20. should check out this site

Rather depressing, isn’t it? Spam, spam, spam, spam…

Last up, something I haven’t seen before, a look at the most-common numbers that occured in the text of tweets, truly “Twitter by the Numbers”:

The top numbers were:

  • 2 (likely in first place because it is also used as short form of “two”, “too” and “to”
  • 1
  • 4 (also used as short form of “for”)
  • 3
  • 5
  • 2010
  • 10
  • 7
  • 6
  • 100
  • 8
  • 20
  • 9
  • 12
  • 30
  • 15
  • 11
  • 50
  • 0
  • 24

(I also have a list of the top URL’s included in tweets.  But they are almost entirely via URL shortners (bit.ly, etc.) where the link no longer works, taken down by the service no doubt for being used in spam.)

If anyone has any further ideas for analysis, let me know.  One thing I’d like to do is chart the percentage of tweets that come from various Twitter clients over time, to track market share statistics.  If I can find a good language classifier (one that can work even on very short text fragments) I can do a breakdown of those.

  • Tweet

Filed Under: Blogging/Social

Top 10 Blog Posts of 2009

2010/01/01 By Rob 6 Comments

The 2009 wall calendar is now tossed in recycling bin, and I look to 2010 with renewed energy and dedication.  But I did want to take once last parting look at 2009, from the perspective of this blog’s server logs.

Top Blog Posts

  1. Update on ODF Spreadsheet Interoperability (May 2009)
  2. ODF Lies and Whispers (June 2009)
  3. A Game of Zendo (July 2006)
  4. A follow-up on Excel 2007 SP2’s ODF support (May 2009)
  5. The Final OOXML Update: Part I (October 2009)
  6. The Formats of Excel 2007 (January 2007)
  7. The Final OOXML Update: Part III (October 2009)
  8. Taking Control of Your Documents March 2009)
  9. The Battle for ODF Interoperability (May 2009)
  10. The Chernobyl Design Pattern (October 2006)

Top Browsers

  • Firefox: 57.3%
  • Internet Explorer: 22.9%
  • Safari: 5.2%
  • Mozilla 4.7%
  • Chrome: 3.8%
  • Opera: 3.4%
  • Mobile (various browsers): 1.4%
  • Konqueror :1.3%

Top Operating Systems

  • Windows: 62.1%
  • Linux 26.8%
  • Mac 9.7%
  • Mobile 1.4%
  • Tweet

Filed Under: Blogging/Social Tagged With: ODF, OOXML

Planned Migration of An Antic Disposition

2009/12/16 By Rob 5 Comments

Sometime over the next two weeks I’ll be migrating An Antic Disposition over to WordPress, introducing a new visual theme, and relocating to a new hosting company.  This will allow some additional capabilities that I look forward to enabling down the road.

My plan is to preserve all of the comments during the migration, not to break any incoming links, and to minimize any downtime.  That is the plan.  But minimal downtime is not the same as zero downtime, so don’t be surprised if you see me not here, at least occasionally.

One last thing to check, dear reader, especially if you follow me via my feed.  Around a year ago I wrapped my feed via FeedBurner.  If you have subscribed since then, you should be fine, since that FeedBurner URL will continue to work.  However, if you still subscribe to my old original Blogger feed (http://www.blogger.com/feeds/11236681/posts/full) then you will need to resubscribe with the new URL:

The main feed is: http://feeds.feedburner.com/robweir/antic-atom


12/28/09 Update

I’ve completed the migration from Blogger to WordPress.  It went easier than anticipated.  The posts and comments came over without problems.  I think I was able to preserve almost all of the post permalinks.  I’ll monitor the logs for 404 errors and add 303 redirects to fix any remaining URL mismatches.  However, I have not made any attempt to preserve the URLs for the archive or tag pages.  For the various legacy feeds, I’ve redirected all of them to the FeedBurner feed.

  • Tweet

Filed Under: Blogging/Social

Being social

2009/02/28 By Rob 4 Comments

By nature I am an introvert. I don’t schmooze. I don’t “network”. Like Sartre, I am firmly in the “Hell is other people” camp. However, since social and collaborative computing is large part of what we work on at IBM, and we’ve recently signed deals with LinkedIn and Skype, I’ve decided to jump in with both feet and see what value these and other social networking and communication services have to offer.

Certainly, within IBM, I’m constantly typing into Sametime. I wouldn’t be surprised if I exchange more internal information, counted by characters, in instant messages, than I do in emails. However, in my external communications, both professional and personal, it is almost entirely via email for 1-to1 communications, and this blog for broadcasts. I’d like to experiment a bit and see what other tools and services are effective. This isn’t a long term commitment to being social, but a experiement. We’ll see how it goes.

So, I’ve put up my contact information for various social sites on my Who is Rob Weir? page. Feel free to contact me via these services. Also, I’d be interested in what other services you think I should be looking at.

  • Tweet

Filed Under: Blogging/Social

  • Go to page 1
  • Go to page 2
  • Go to Next Page »

Primary Sidebar

Copyright © 2006-2023 Rob Weir · Site Policies


Loading Comments...