I’ve been playing around today with a preview build of the ODF Java API ODFDOM 0.9. One of the capabilities we’re adding is a simple text extraction API.
The idea is to have a very simple API, a single function call in fact, that will allow you to extract the plain text from an ODF document. So strip all formatting, all layout and just return the text. At first you might think this is rather useless, but further reflection shows that it has myriad uses, including accessibility, search indexing, collaborative filtering, and text analytics in general.
Extracting text from ODF is pretty simple. There are a handful of special cases to watch out for. One example is a single word that has mixed styles, e.g.: ODFDOM. In ODF this looks like:
<text:span text:style-name="style1">ODF</text:span>

<text:span text:style-name="style2">DOM</text:span>
We want text extraction to come out as “ODFDOM” not “ODF DOM” with a space.
On the other hand, there are other examples of adjacent elements, like with footnote citations, where we need to insert a space to prevent two adjacent strings from being conflated.
Overall, the build I used looks pretty good, and works the same across text, spreadsheets and presentations.
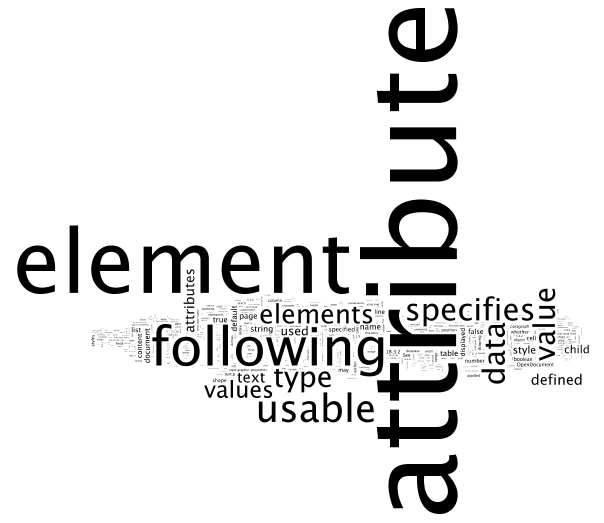
So I was looking this afternoon for something I could use to demo this new capability. I thought of using Jonathan Feinberg’s excellent Wordle applet (which I wrote about a while back). This applet creates a word cloud, based on word frequency of text you feed it. As a torture test I decided to feed it the text of ODF 1.2 Committee Draft 05, the version that is currently out for public review.
This is what I got for results.
Part 1 is the annotations the schema for ODF. As expected, the key words are those referring to XML markup concepts like “attribute” and “element”:
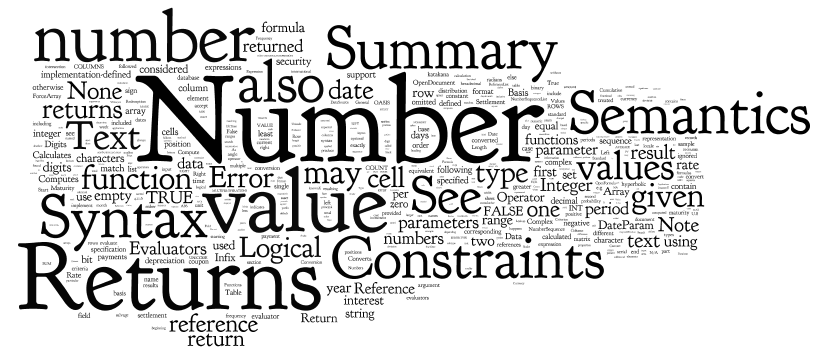
Part 2: is OpenFormula, the spreadsheet formula express language. No XML in this part. In fact, this looks more like what I’d expect from an excerpt from a programming language specification, which pretty much what OpenFormula is.
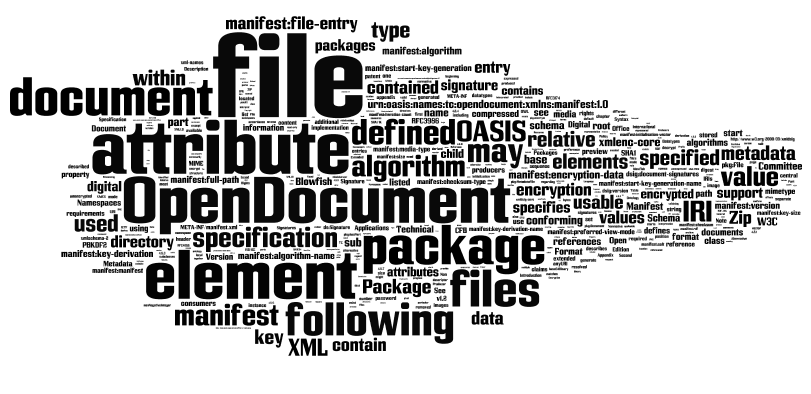
And Part 3 is the packaging specification.
In the end text extraction is just the data preparation step. The real fun happens after, with the analysis and visualization techniques that can be applied to the text once extracted.
If anyone is interested in trying out the text extraction module, please let me know. We’re aiming for a release of ODF 0.9 toward the end of August, but I can probably get you a preview, if you are interested in testing. And let me know if you have any brilliant ideas of what to do with the extracted text. I’m always looking for good demo material.
Hi Rob,
not sure where to suggest this, but perhaps ODF 1.3 could incorporate this if not already in 1.2
Animated graphs like those in Gapminder (http://www.gapminder.org) . Essentially the disposition of points on a scattergraph, or segments in a pie chart etc vary according to some other variable usually time) attached to a slider. I can see a generalisation where you could have multiple sliders allowing things to be varied. A default would be needed for printing out a particular disposition.
Apologies if this functionality is already possible in the spreadsheet.
Cool stuff.
Not really related to ODF, but I found the word clouds you produced to be strangely compelling, and almost beautiful; not by themselves, but when considered in the context of the source document they were derived from. If art can be viewed as presenting at an immediate perceptual level, a gut level, something rather complex in conceptual terms, then this would be a good example of the rather elusive idea of ‘computer generated art’.
Such forms have been controversial, as art, but I think this example provides a compelling argument that there may be merit in it. The ultimate source was a creative and disciplined endeavor of precise conceptual constructs. The outcome is perceptual. The entire process is completely human; while the intermediate stages and output stage were performed by a computer, I would hold that in this case the computer was a close analogue to a brush.
@Thomas, it kind of reminds me of Arabic calligraphy, a similar space-filling style.
@Nomen, Cool. I just spent way too much time at Gapminder. Great example of the kind of visualizations that are possible if you can mashup a variety of keyed open data sets. From ODF perspective, I think we need a meta language to describe such charts. Problem is spreadsheets are constantly adding new chart types, and a standard will never be able to keep up. But if we can describe the data in terms of independent and dependent series, or nominal, ordinal and ratio quantities, and units and dimensions, etc., then we can make the data be portable while allowing a particular implementation to show the most suitable rendering of the data, from the repertoire of chart types it has available. That’s my initial thought, but I need to think on this some more.