In the previous two parts (one and two) I described a model of product adoption and market share that could be built with a single survey question. I applied this model to the open source productivity suites OpenOffice and LibreOffice, looking at adoption in September 2012 and April 2013.
The results were described in detail in the previous article in this series, but can be summarized as:
| OpenOffice | September 2012 | April 2013 | Change |
| Customer Awareness | 24.3% | 27.6% | 14% growth |
| Customer Motivation | 63.0% | 65.9% | 5% growth |
| Customer Satisfaction | 70.6% | 68.7% | 3% decline |
| Market Share | 10.8% | 12.5% | 16% growth |
Six months have now passed and it is worth taking another look to see how things have evolved. As I did previously, I used Google’s Consumer Survey service which uses sampling and post-stratification weighting to match the target population, which in this case was the US internet population. In other words, the survey is weighted to reflect the population demographics, for age, sex, region of the country, urban versus rural, income, etc. I did this survey in a personal capacity for my own interest. The Standard Disclaimer applies.
| OpenOffice (N=1519) | September 2012 | April 2013 | September 2013 | Change (September to September) |
| Customer Awareness | 24.3% | 27.6% | 30.7% | 26% growth |
| Customer Motivation | 63.0% | 65.9% | 67.4% | 7% growth |
| Customer Satisfaction | 70.6% | 68.7% | 77.8% | 10% growth |
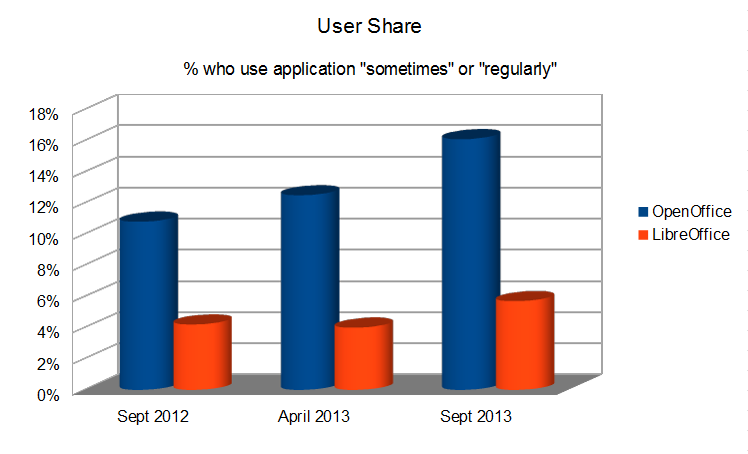
| Market Share | 10.8% | 12.5% | 16.1% | 49% growth |
So what do we see? Very nice results, indeed. The OpenOffice brand is strong and growing. Over 30% of consumers surveyed had heard of it. Of those who had heard of it, 67% had given it a try. That number is changed little. This is an opportunity for Apache OpenOffice marketing volunteers to improve both of these numbers. Of those who tried OpenOffice almost 78% continued to use OpenOffice. This is a modest increase, but there is certainly room to improve here. Put it altogether, and the estimated user share, the percentage of US internet users who use OpenOffice “sometimes” or “regularly” is 16.1%, nearly a 50% improvement year-over-year.
In any case, to summarize and to illustrate the improvements graphically, I’ve charted the growth in user share over the three surveys, including results for LibreOffice as well:
Leave a Reply